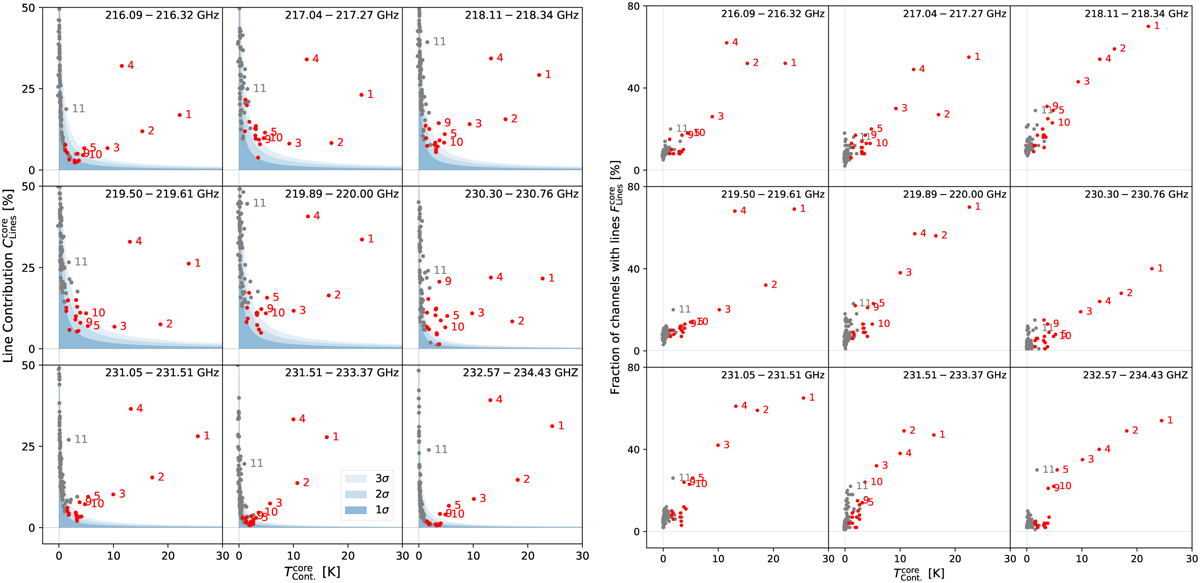
Fig. 4
Download original image
Relative line contribution to the total flux (left) and fraction of channels that contain molecular emission (right) as a function of the continuum level obtained for the 1.3 mm bands. Red dots represent high-mass cores with M > 10 M⊙, grey dots represent the other cores. The blue areas represent the results for spectra without many lines above the 1σ, 2σ, and 3σ levels, where σ is the rms noise level in one channel of the corresponding band. Cores identified as containing a hot core following the criterion described in Sect. 1 are marked by their core number.
Current usage metrics show cumulative count of Article Views (full-text article views including HTML views, PDF and ePub downloads, according to the available data) and Abstracts Views on Vision4Press platform.
Data correspond to usage on the plateform after 2015. The current usage metrics is available 48-96 hours after online publication and is updated daily on week days.
Initial download of the metrics may take a while.