Open Access
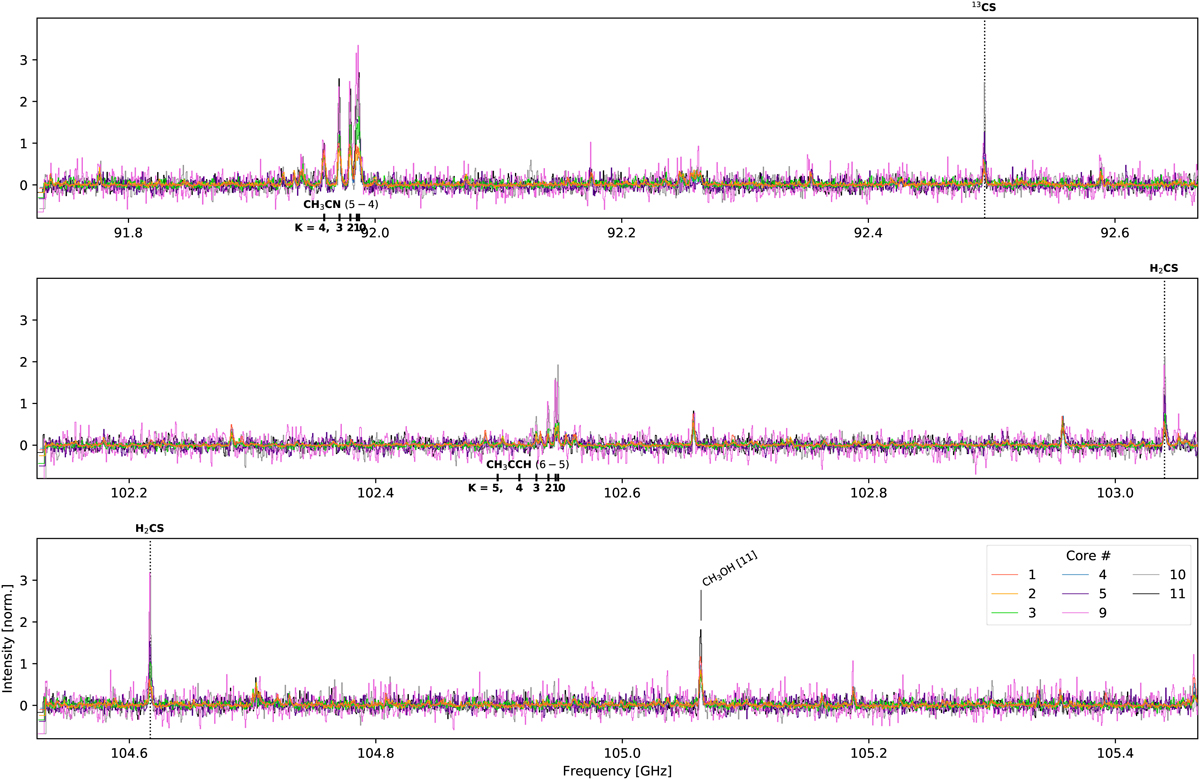
Fig. A.1
Download original image
Comparison of the spectra of the eight hot cores. The spectra are aligned in velocity and multiplied by a factor in order to normalise the methyl formate lines of the 216200 and 218200 MHz bands. The hatched rectangles indicate the regions of the spectra with strong noise.
This figure is made of several images, please see below:
Current usage metrics show cumulative count of Article Views (full-text article views including HTML views, PDF and ePub downloads, according to the available data) and Abstracts Views on Vision4Press platform.
Data correspond to usage on the plateform after 2015. The current usage metrics is available 48-96 hours after online publication and is updated daily on week days.
Initial download of the metrics may take a while.