Fig. 6
Download original image
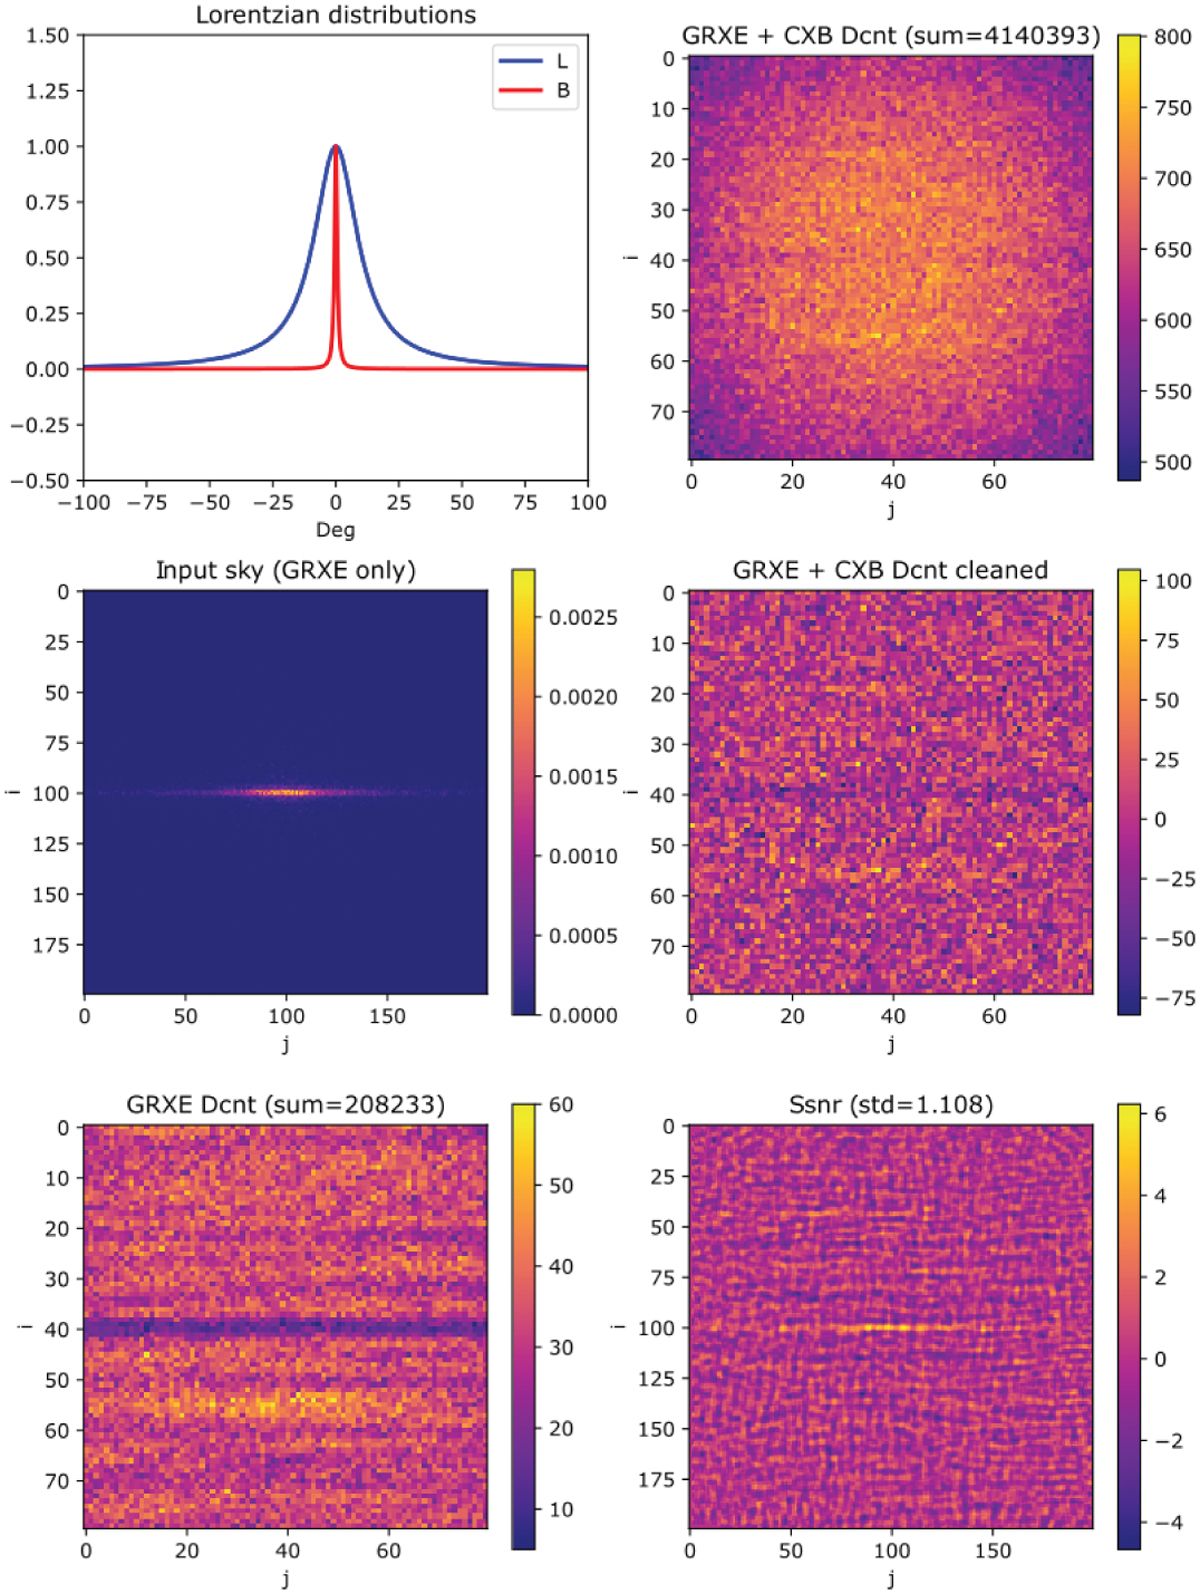
Study of the GRXE in 20 min (scale n = 6) in 4–10 keV. Top left: the two Lorentzian functions used to model the GRXE in Galactic longitude and latitude. Middle left: sky map of the points sources used to simulate the GRXE diffuse emission. Bottom left: shadow-gram in counts on the detector (only GRXE). Top right: shadowgram in counts (GRXE and CXB combined). Middle right: shadowgram after correction by quadratic fit. Bottom right: reconstructed sky image in S/N.
Current usage metrics show cumulative count of Article Views (full-text article views including HTML views, PDF and ePub downloads, according to the available data) and Abstracts Views on Vision4Press platform.
Data correspond to usage on the plateform after 2015. The current usage metrics is available 48-96 hours after online publication and is updated daily on week days.
Initial download of the metrics may take a while.