Open Access
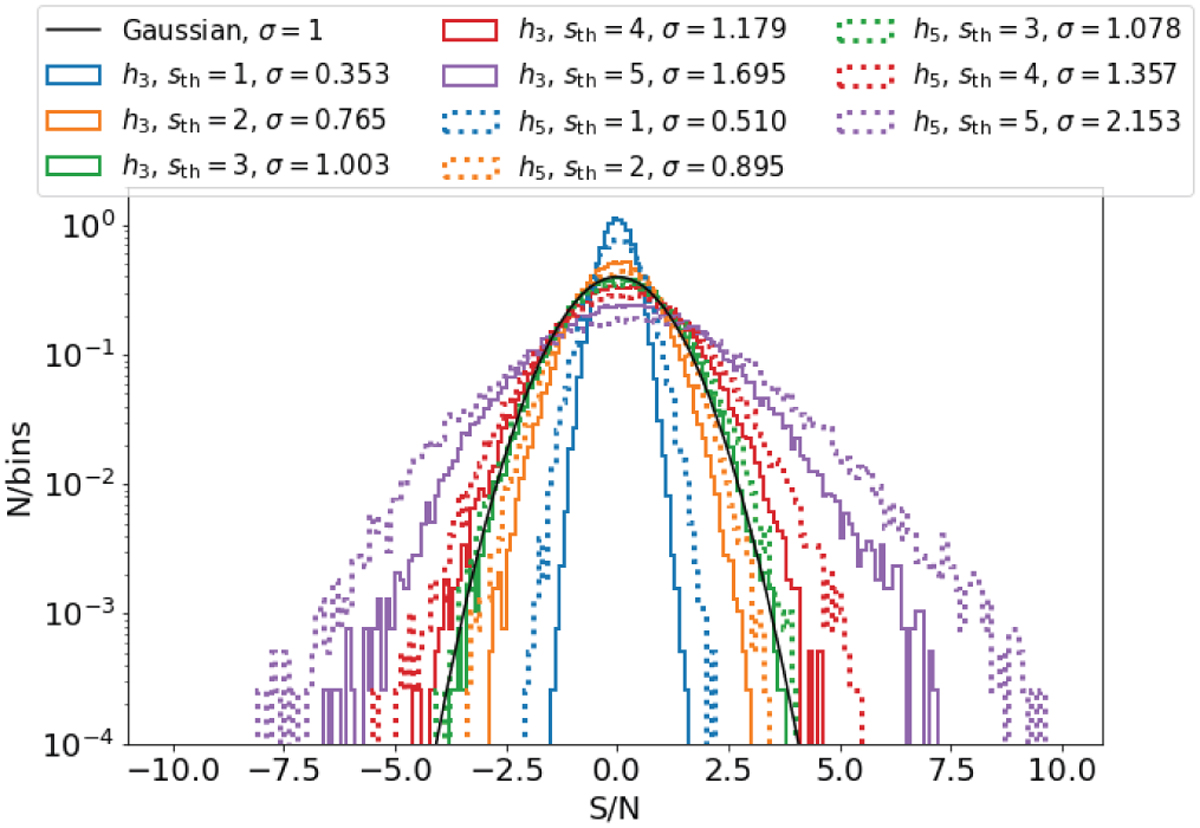
Fig. 4
Download original image
Distribution of the S/N in 20 min sky images for different combinations of the filter size and the maximum scale used for the wavelet cleaning. The black solid curve corresponds to the normal distribution. The best parameters (h3, sth = 3) are shown as the solid green curve.
Current usage metrics show cumulative count of Article Views (full-text article views including HTML views, PDF and ePub downloads, according to the available data) and Abstracts Views on Vision4Press platform.
Data correspond to usage on the plateform after 2015. The current usage metrics is available 48-96 hours after online publication and is updated daily on week days.
Initial download of the metrics may take a while.