Fig. 16
Download original image
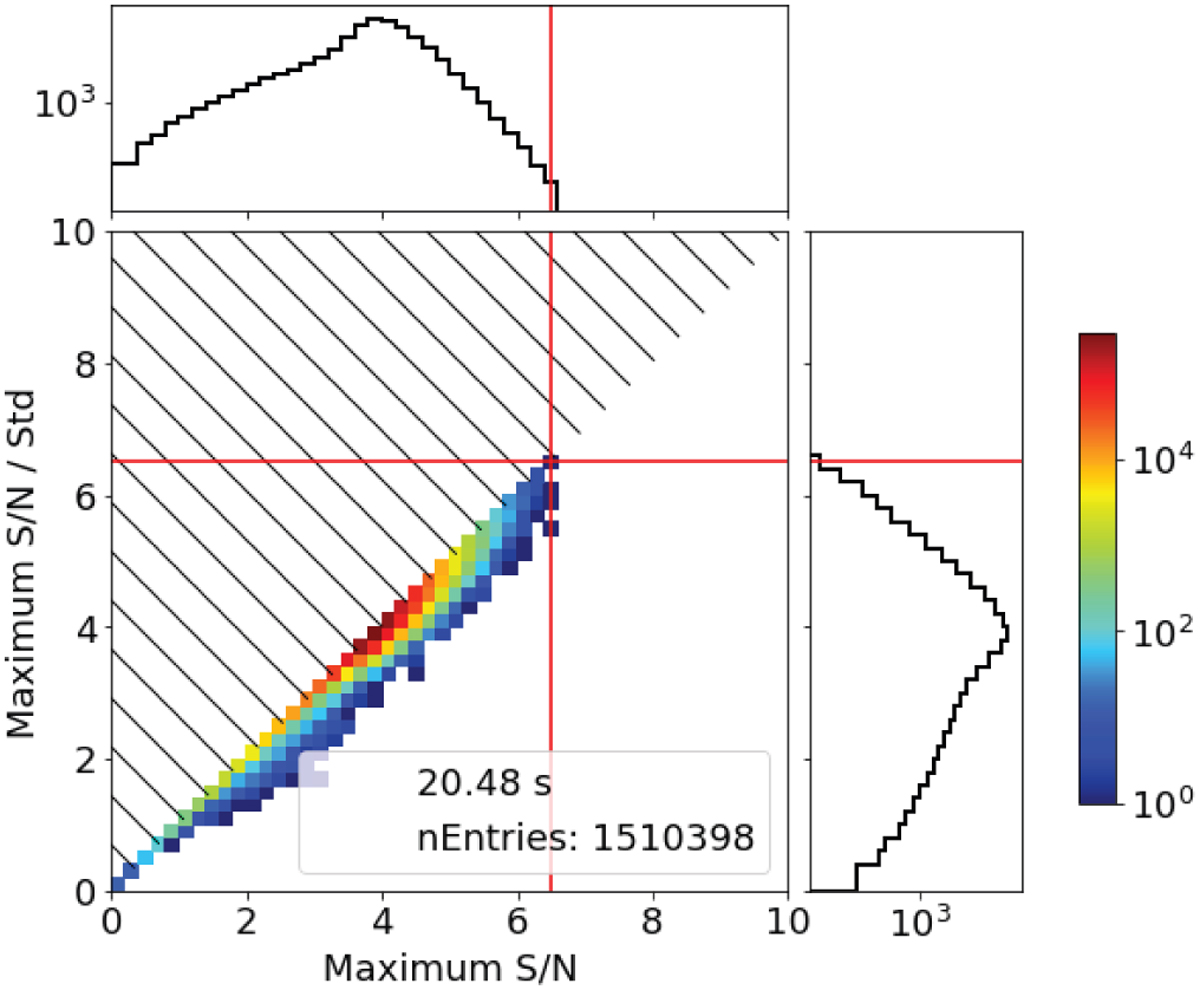
Two-dimensional distribution of the maximum S/N vs the maximum S/N divided by the standard deviation for each sky image of 20 s. The colour corresponds to the number of entries (sky image) in each bin. The red lines show the threshold applied on each axis. The background is corrected with the fit method. The hatched area corresponds to a region that is never populated because the standard deviation used for division is never smaller than 1.
Current usage metrics show cumulative count of Article Views (full-text article views including HTML views, PDF and ePub downloads, according to the available data) and Abstracts Views on Vision4Press platform.
Data correspond to usage on the plateform after 2015. The current usage metrics is available 48-96 hours after online publication and is updated daily on week days.
Initial download of the metrics may take a while.