Open Access
Fig. 15
Download original image
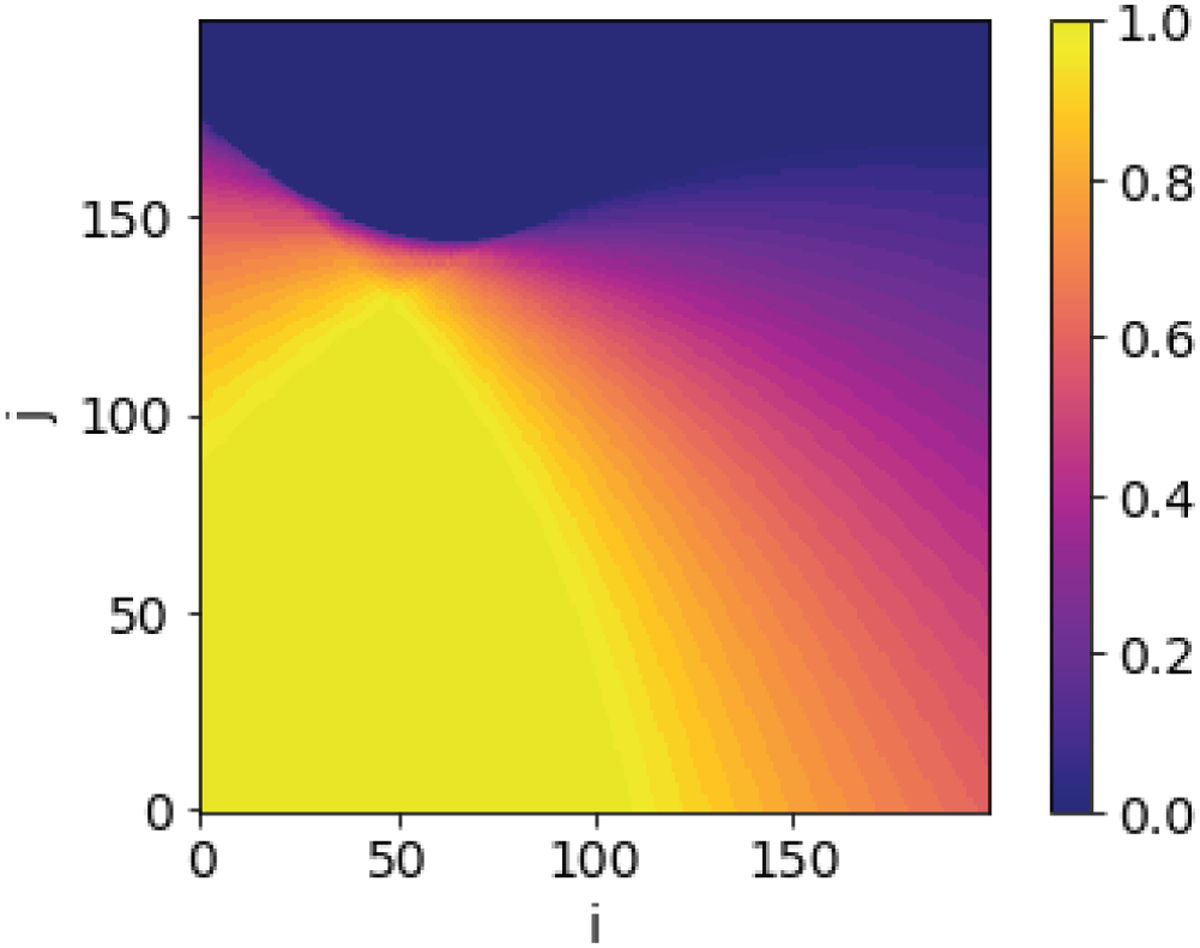
Exposure map for the 20 min corresponding to the sky image shown in Fig. 13. The value 1 corresponds to the regions that are always obscured by the Earth, the value 0 to those that are never obscured.
Current usage metrics show cumulative count of Article Views (full-text article views including HTML views, PDF and ePub downloads, according to the available data) and Abstracts Views on Vision4Press platform.
Data correspond to usage on the plateform after 2015. The current usage metrics is available 48-96 hours after online publication and is updated daily on week days.
Initial download of the metrics may take a while.