Fig. 1
Download original image
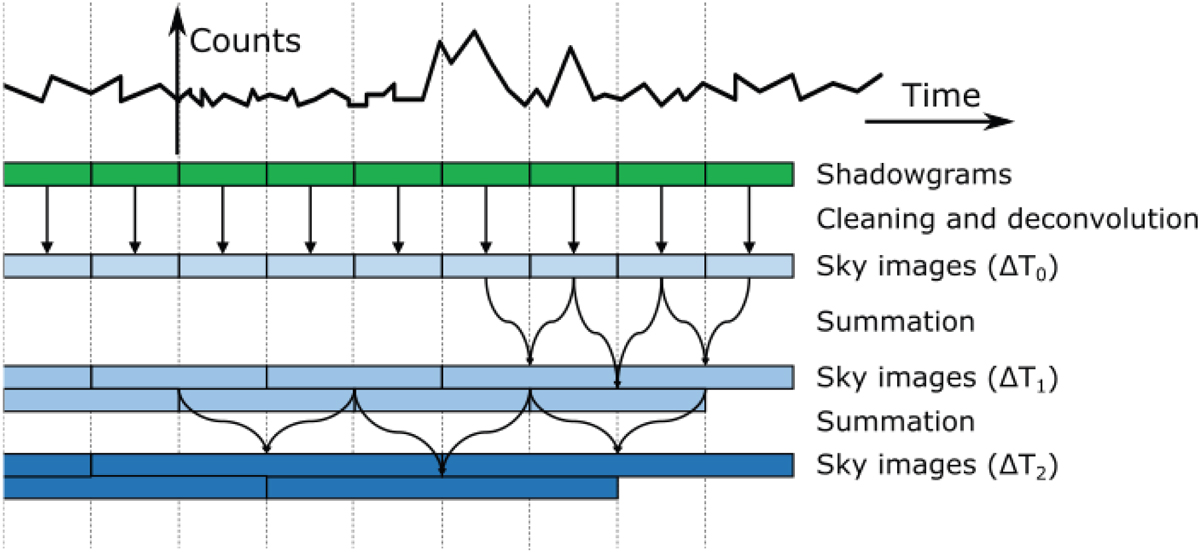
Illustration of the algorithm behind the image trigger for one energy strip. The vertical dotted lines delimit portions of 20.48 s. The green blocks correspond to shadowgrams that are corrected and deconvolved. The blue blocks correspond to the images of the sky. For visibility, only scales n = 0, n = 1, and n = 2 are shown (scale n = 6 is the result of the sum of 64 images of 20.48 s).
Current usage metrics show cumulative count of Article Views (full-text article views including HTML views, PDF and ePub downloads, according to the available data) and Abstracts Views on Vision4Press platform.
Data correspond to usage on the plateform after 2015. The current usage metrics is available 48-96 hours after online publication and is updated daily on week days.
Initial download of the metrics may take a while.