Fig. 9
Download original image
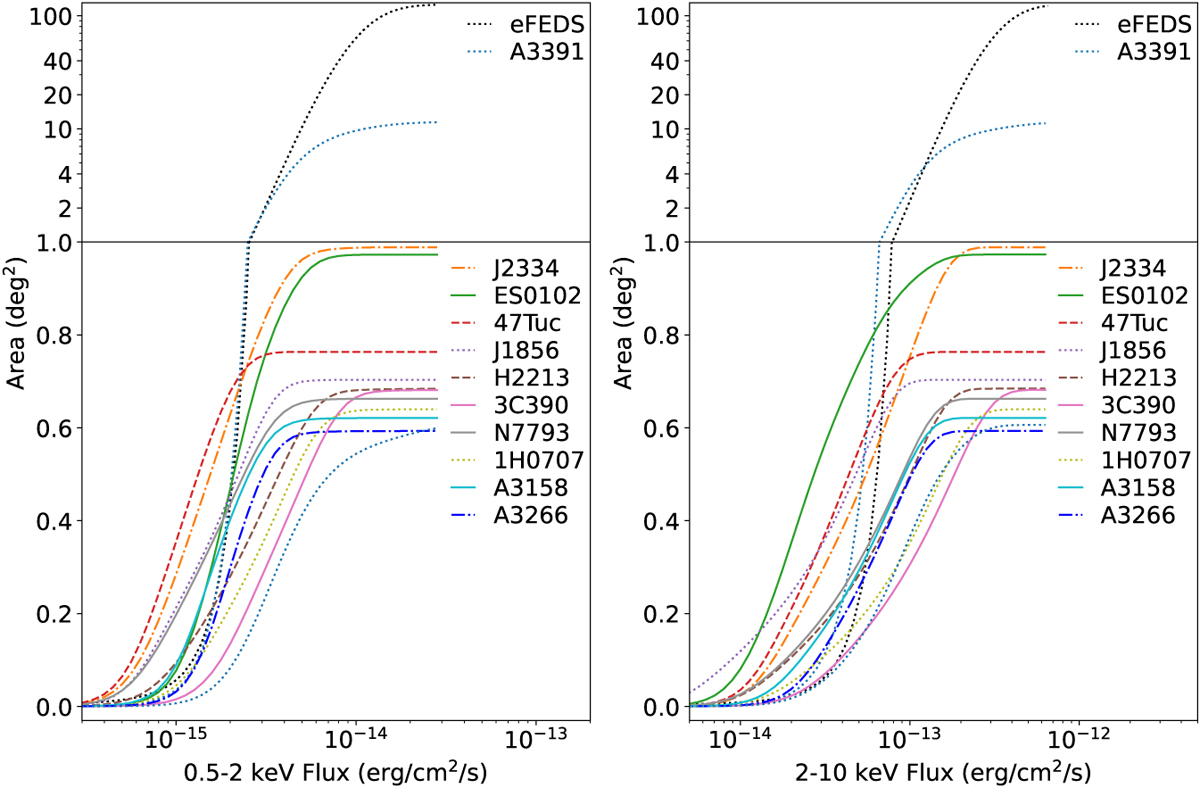
Sky coverage of each field as a function of 0.5–2 and 2–10 keV Galactic-absorption-corrected fluxes in the point-source subsurvey region. The eFEDS survey is also plotted with black dotted lines for comparison. All the sky coverage curves are calculated corresponding to an aperture-photometry likelihood threshold of 10. The same colors and line styles are adopted as in Fig. 8. For representation, we divide each figure into two parts and adopt linear scale and log scale respectively. For the field A3391, besides the overall sky coverage, we also plot the sky coverage calculated for the pointing-mode observation (300014) within an off-axis angle of 28′.
Current usage metrics show cumulative count of Article Views (full-text article views including HTML views, PDF and ePub downloads, according to the available data) and Abstracts Views on Vision4Press platform.
Data correspond to usage on the plateform after 2015. The current usage metrics is available 48-96 hours after online publication and is updated daily on week days.
Initial download of the metrics may take a while.