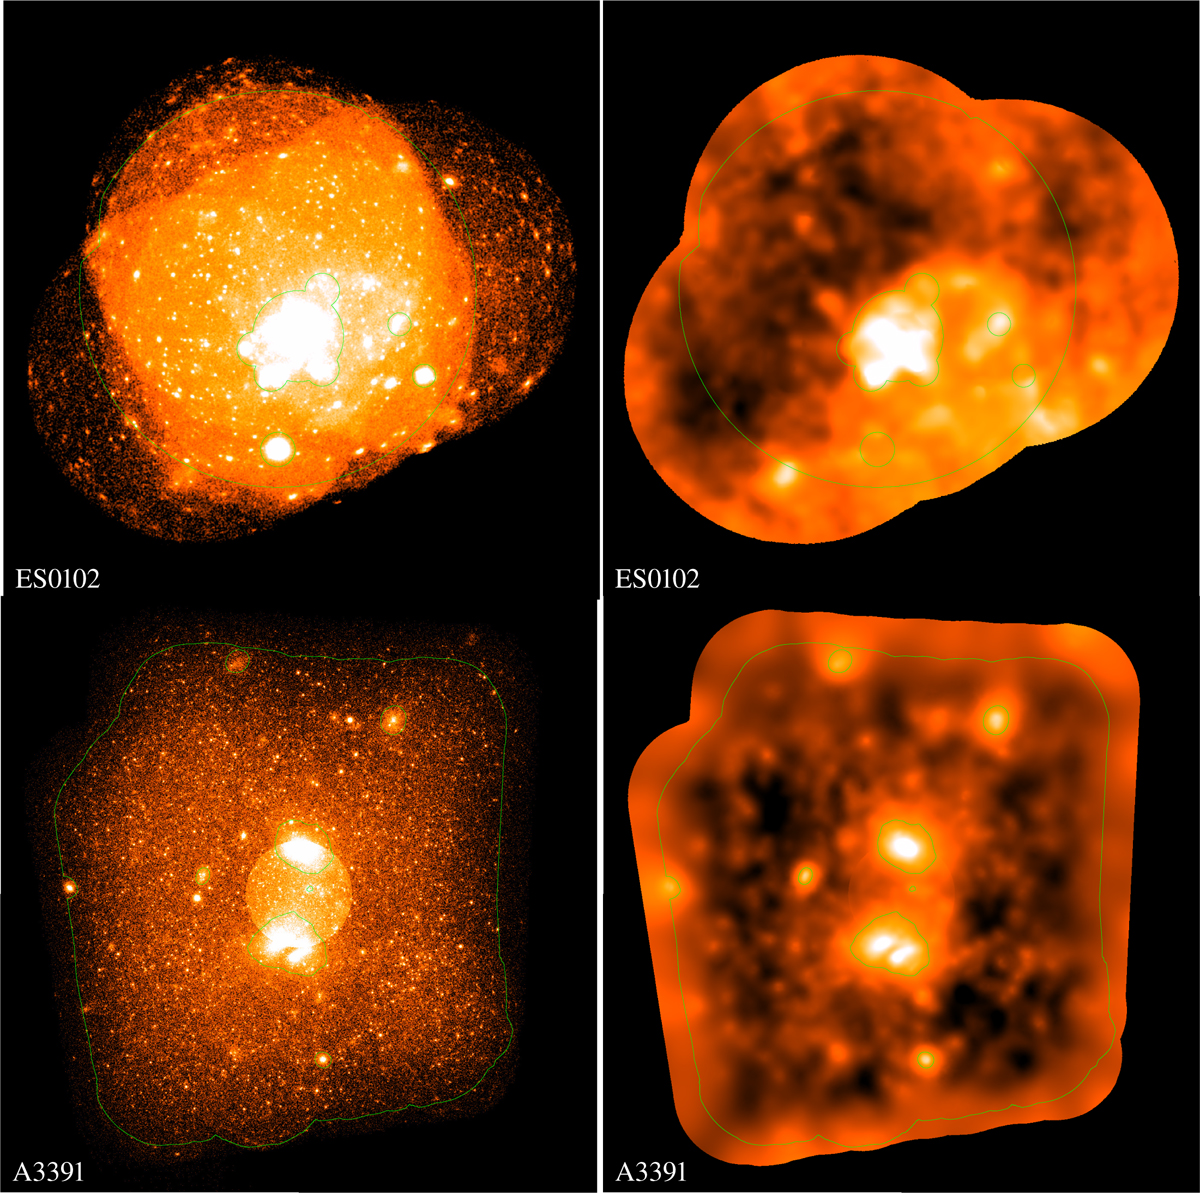
Fig. 2
Download original image
0.2–2.3 keV images (left) and 0.6–2.3 keV background maps divided by exposure maps (right) for the ES0102 (upper) and A3391 (lower) fields. The same as in Fig. 1, the green lines display the subsurvey regions (Sect. 4.5). The A3391 photon image shows a bright circle at the center, which corresponds to a long-exposure pointing-mode observation (300014; see Table 2).
Current usage metrics show cumulative count of Article Views (full-text article views including HTML views, PDF and ePub downloads, according to the available data) and Abstracts Views on Vision4Press platform.
Data correspond to usage on the plateform after 2015. The current usage metrics is available 48-96 hours after online publication and is updated daily on week days.
Initial download of the metrics may take a while.