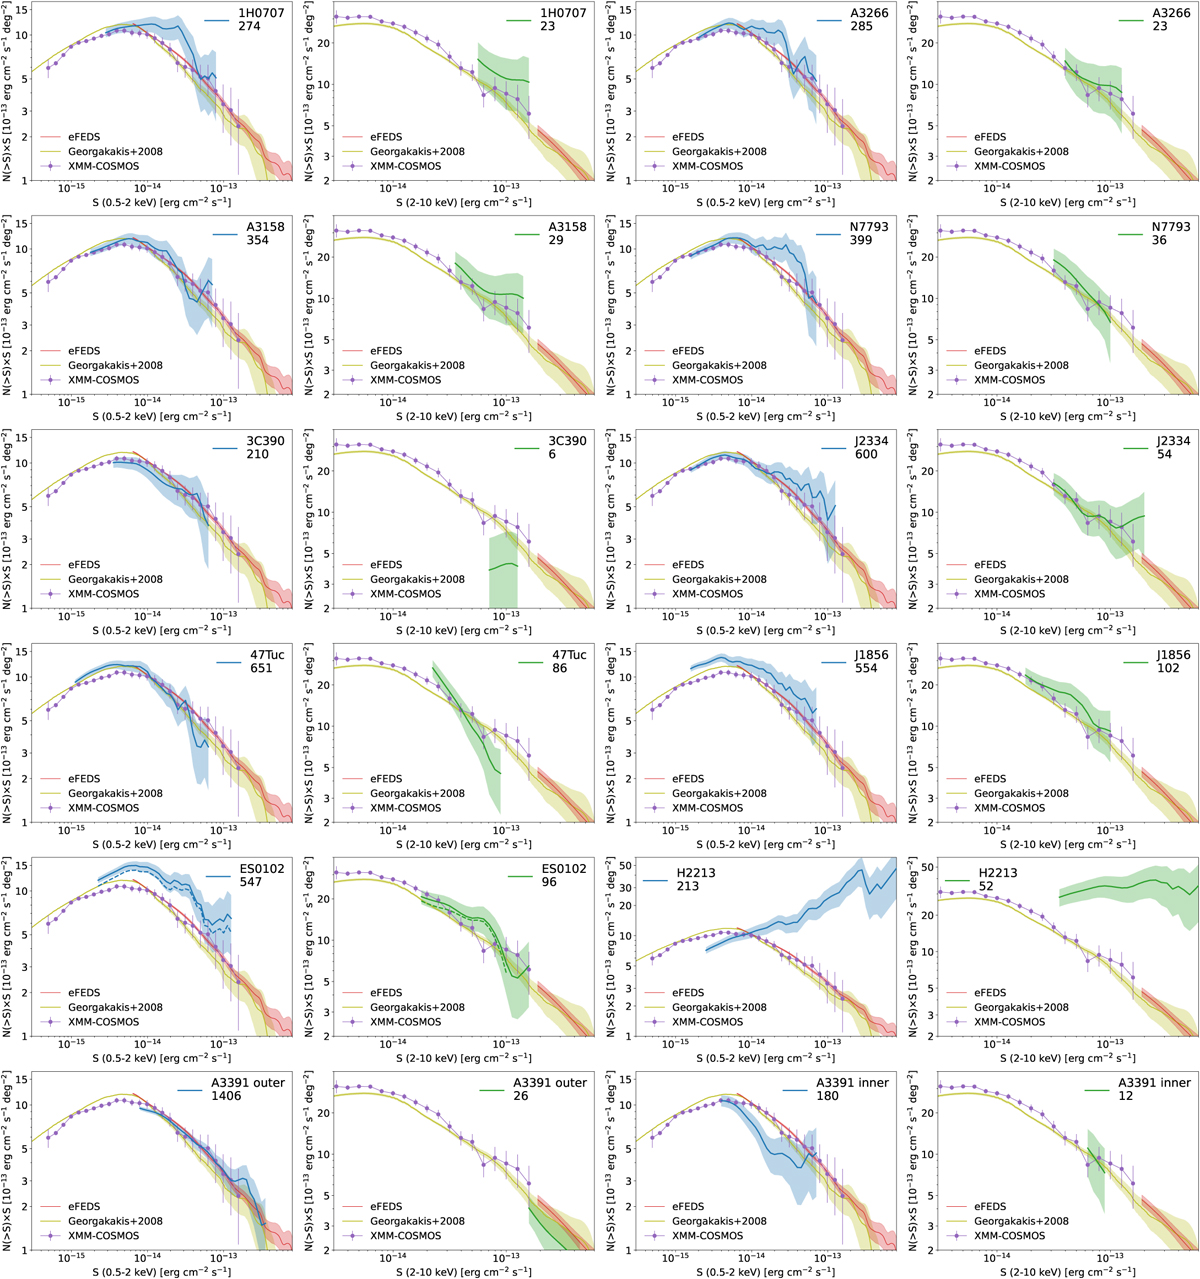
Fig. A.1
Download original image
Point source number counts in the point-source subsurvey region of each field as a function of the 0.5-2 keV (blue) and 2–10 keV (green) Galactic-absorption-corrected fluxes. For representation, the cumulative number density (y-axis) is multiplied by the flux limit in units of (10−13 erg cm−2 s−1). The lower boundary of the plotted flux range corresponds to 50% sensitivity (50% of the total area in the sky coverage curve) in the soft band and 30% sensitivity in the hard band. The shaded region indicates the 1-σ uncertainty calculated as the square root of the source number. For comparison, we plot the number counts from three previous extragalactic X-ray surveys. The A3391 field is divided into two parts, as displayed in the bottom panels. For ES0102, the dashed lines indicate the number counts with the SMC stars removed.
Current usage metrics show cumulative count of Article Views (full-text article views including HTML views, PDF and ePub downloads, according to the available data) and Abstracts Views on Vision4Press platform.
Data correspond to usage on the plateform after 2015. The current usage metrics is available 48-96 hours after online publication and is updated daily on week days.
Initial download of the metrics may take a while.