Fig. 13
Download original image
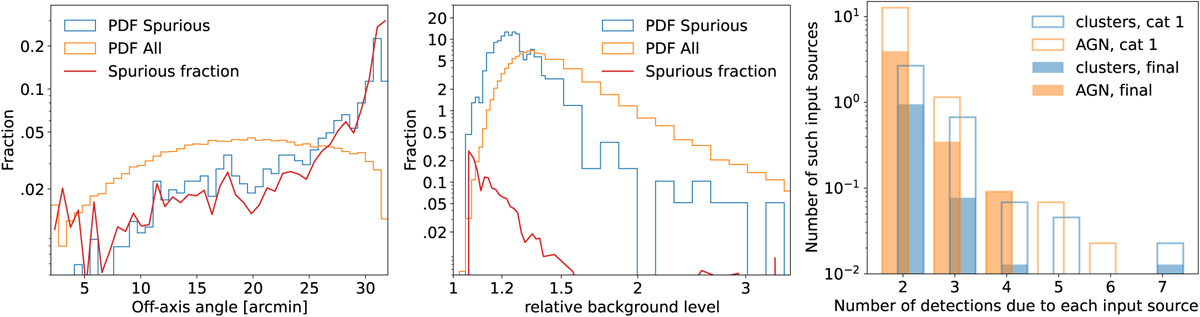
The left and middle panels display the probability distributions of spurious sources (ID_Any<0; blue) and all sources (orange) for the 100 ks simulations as a function of off-axis angle (left) and relative background level (middle), respectively. The right panel displays the numbers of AGN (orange) and galaxy clusters (blue) detected as multiple sources in one field for the “PSF-fitting catalog 1” (empty) and the final catalog (filled), respectively. Only sources with an off-axis angle <26′ are plotted in the middle and right panels.
Current usage metrics show cumulative count of Article Views (full-text article views including HTML views, PDF and ePub downloads, according to the available data) and Abstracts Views on Vision4Press platform.
Data correspond to usage on the plateform after 2015. The current usage metrics is available 48-96 hours after online publication and is updated daily on week days.
Initial download of the metrics may take a while.