Fig. 12
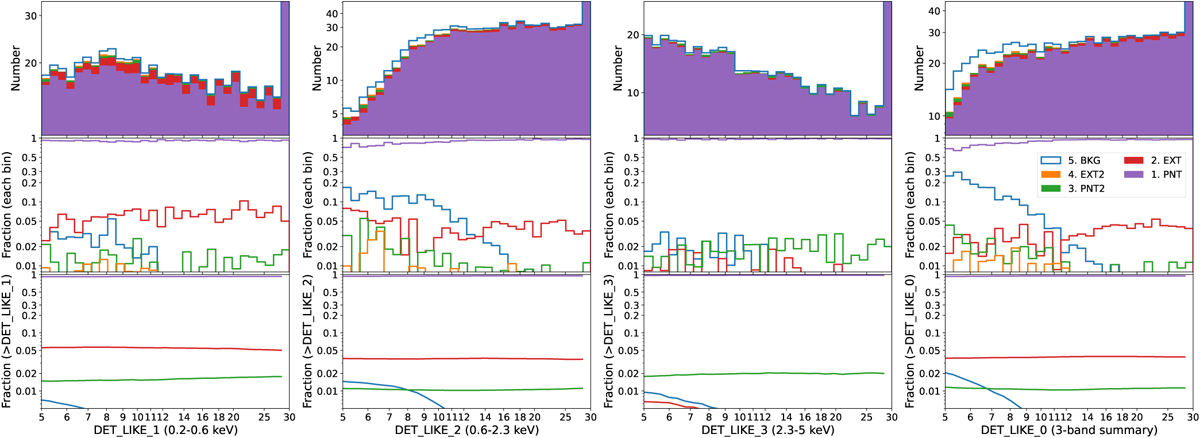
Download original image
Distributions of the five classes of simulated sources detected within an off-axis angle of 28′ and with EXT_LIKE=0, plotted as a function of the detection likelihood DET_LIKE_n, where n indicates the energy band 1 (0.2–0.6 keV), 2 (0.6–2.3 keV), 3 (2.3–5 keV), or 0 (summary of the three bands). The upper, middle, and lower panels display the source numbers, the fraction in each bin, and the fraction above a given likelihood, respectively.
Current usage metrics show cumulative count of Article Views (full-text article views including HTML views, PDF and ePub downloads, according to the available data) and Abstracts Views on Vision4Press platform.
Data correspond to usage on the plateform after 2015. The current usage metrics is available 48-96 hours after online publication and is updated daily on week days.
Initial download of the metrics may take a while.