Fig. 10
Download original image
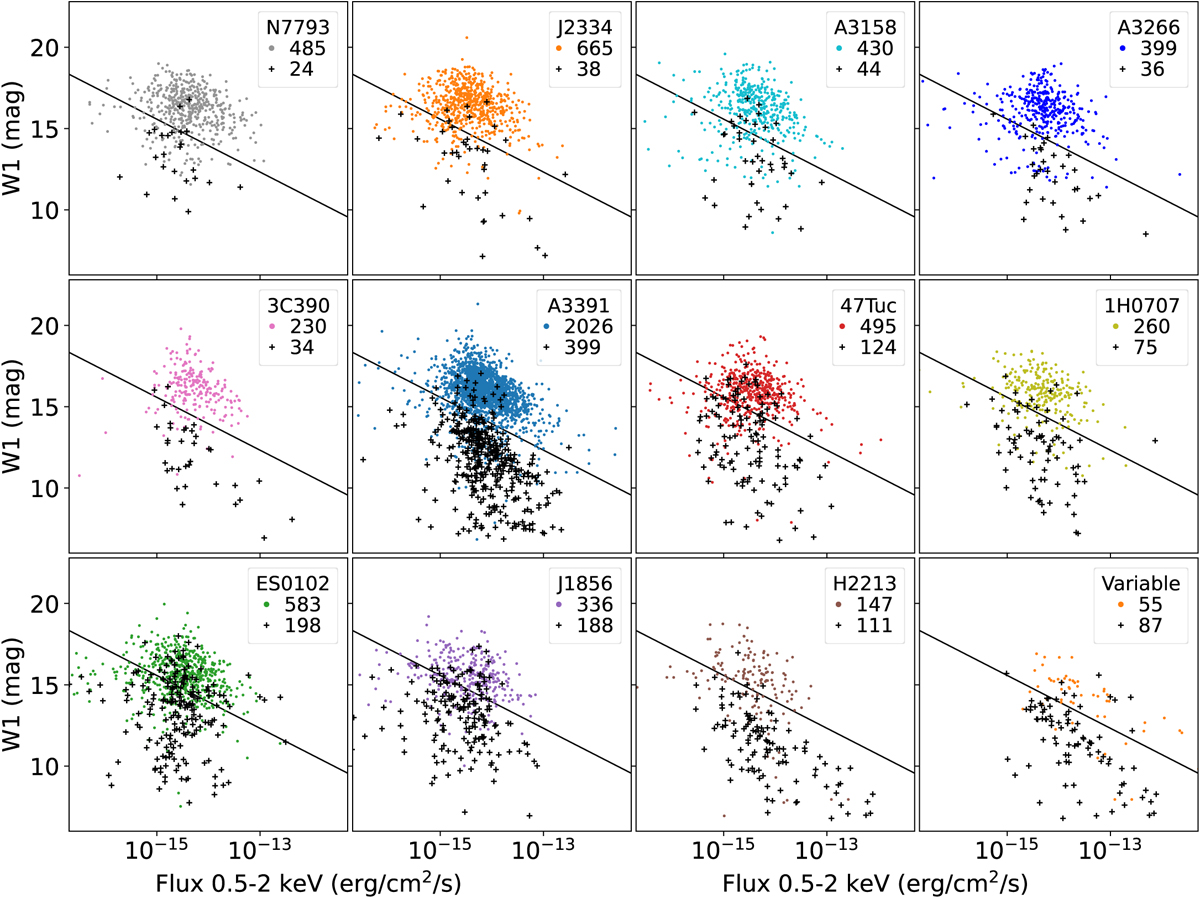
Scatter plots in the 0.5–2 keV X-ray flux (Fx; measured through spectra fitting) and WISE W1-band Vega magnitude (W1) space for catalogs in the 11 fields and for the X-ray variable sources (lower right panel). The black line corresponds to W1 = −1.625 × logFx − 8.8, which is an empirical boundary between AGN and stars (Salvato et al. 2018). The sources with significantly measured proper motions by Gala are plotted in black crosses, and the others are plotted as points. The numbers of sources are printed in each panel.
Current usage metrics show cumulative count of Article Views (full-text article views including HTML views, PDF and ePub downloads, according to the available data) and Abstracts Views on Vision4Press platform.
Data correspond to usage on the plateform after 2015. The current usage metrics is available 48-96 hours after online publication and is updated daily on week days.
Initial download of the metrics may take a while.