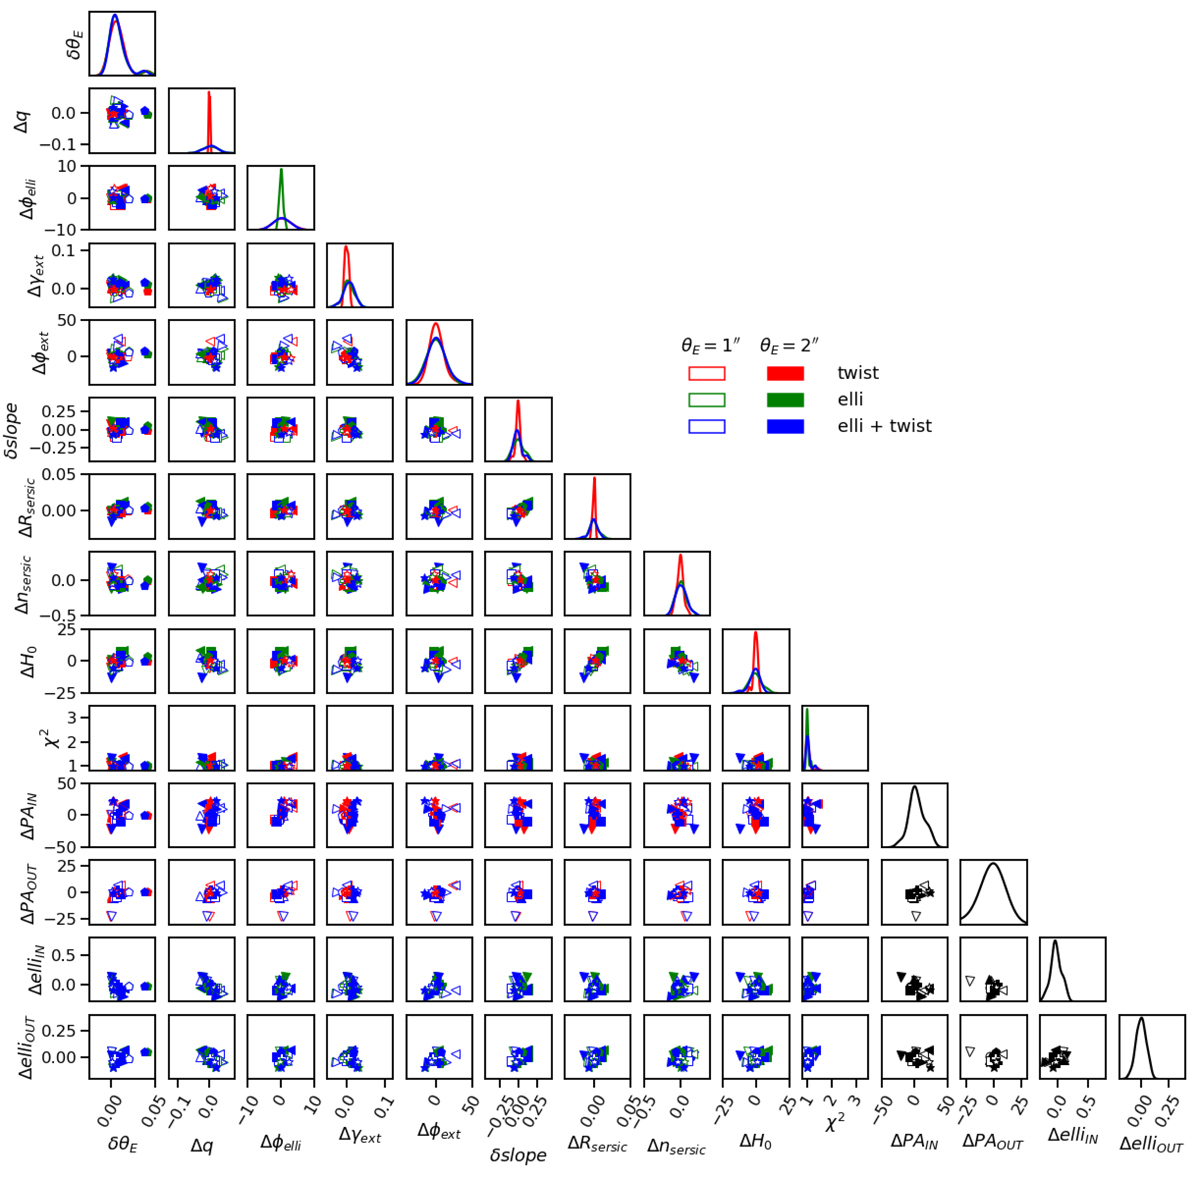
Fig. 7.
Download original image
Population results based on mock mass profiles following the ellipticity and position angle variations observed in local galaxies, using the Kormendy et al. (2009) sample. The nine fiducial galaxies are represented with different symbols, filled when the considered Einstein radius is 2″, and empty for θE = 1″. Each galaxy is used to create three types of mock mass profile: the twist case in which only the position angles follow the original galaxy profile (red), the ellipticity case in which only changes of ellipticity are allowed (green), and the twist + ellipticity variation case (blue). The different mock images, created with the lens mass profile that lenses a circular Sérsic background source, are modeled with a PEMD + shear lens model and a circular Sérsic for the source model. The definition of the first nine quantities is listed in Table 1. The χ2 is the reduced imaging χ2 of the fit. The last four quantities are defined in Sect. 2.2.3. Since these latter quantities are specific to the different galaxies and do not involve any modeling, they are plotted in black. The diagonal cells are KDEs of the marginalized quantity. Only the fits with χ2 < 1.5 are considered for the KDE distributions.
Current usage metrics show cumulative count of Article Views (full-text article views including HTML views, PDF and ePub downloads, according to the available data) and Abstracts Views on Vision4Press platform.
Data correspond to usage on the plateform after 2015. The current usage metrics is available 48-96 hours after online publication and is updated daily on week days.
Initial download of the metrics may take a while.