Fig. 5.
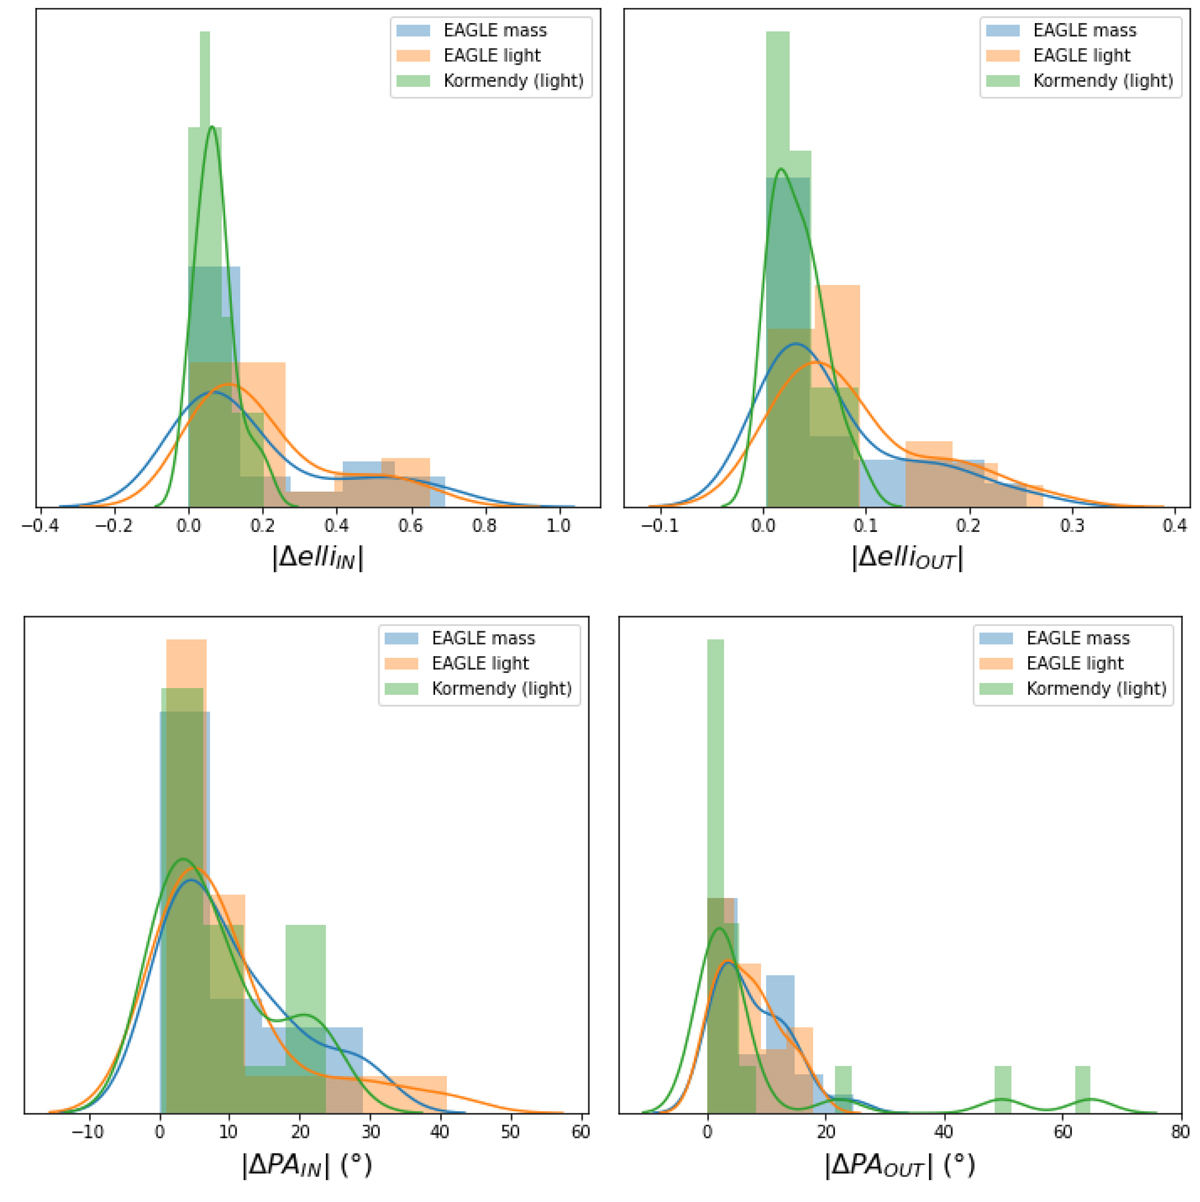
Download original image
Distributions of absolute ellipticity changes (top) and position angles twists (bottom) for the observed and hydro-simulated sample. The left panels summarize changes between 0.25″ and the Einstein radius, and the right panels focus on changes between one and two Einstein radii. The observed sample, using the light of nearby galaxies analyzed by Kormendy et al. (2009; green), is compared to the hydro-simulated sample using the mass of the EAGLE hydrodynamical simulations from Mukherjee et al. (2018; blue). The light profiles associated with the simulated galaxies (orange) is also displayed to facilitate comparison between the two samples.
Current usage metrics show cumulative count of Article Views (full-text article views including HTML views, PDF and ePub downloads, according to the available data) and Abstracts Views on Vision4Press platform.
Data correspond to usage on the plateform after 2015. The current usage metrics is available 48-96 hours after online publication and is updated daily on week days.
Initial download of the metrics may take a while.