Fig. 3.
Download original image
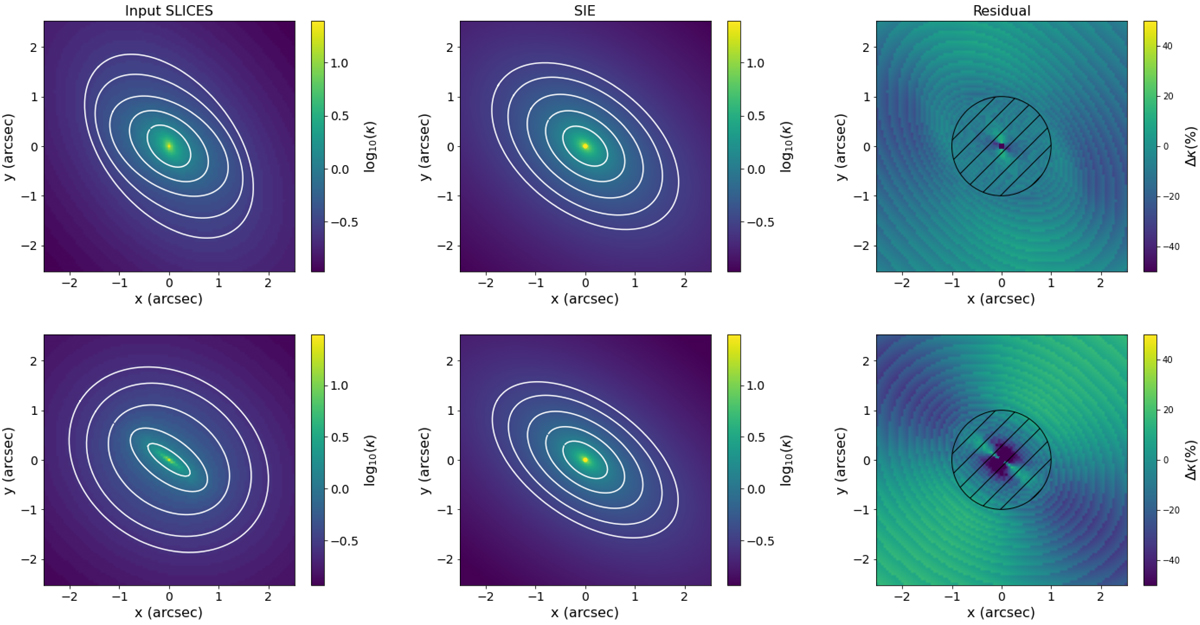
Comparison of mass profiles displaying twists or ellipticity variations with a mass profile following a pure ellipsoid. Left: example of input profiles created with the slice method as explained in Sect. 2.1, displaying either twists (top) or ellipticity changes (bottom). Middle: singular isothermal ellipsoid with the ellipticity and position angle of the corresponding sliced profile at the Einstein radius, i.e., 1″. Right: difference of the two convergence maps in percentage of the input profile. The dashed region indicates the region inside the Einstein radius.
Current usage metrics show cumulative count of Article Views (full-text article views including HTML views, PDF and ePub downloads, according to the available data) and Abstracts Views on Vision4Press platform.
Data correspond to usage on the plateform after 2015. The current usage metrics is available 48-96 hours after online publication and is updated daily on week days.
Initial download of the metrics may take a while.