Fig. 10.
Download original image
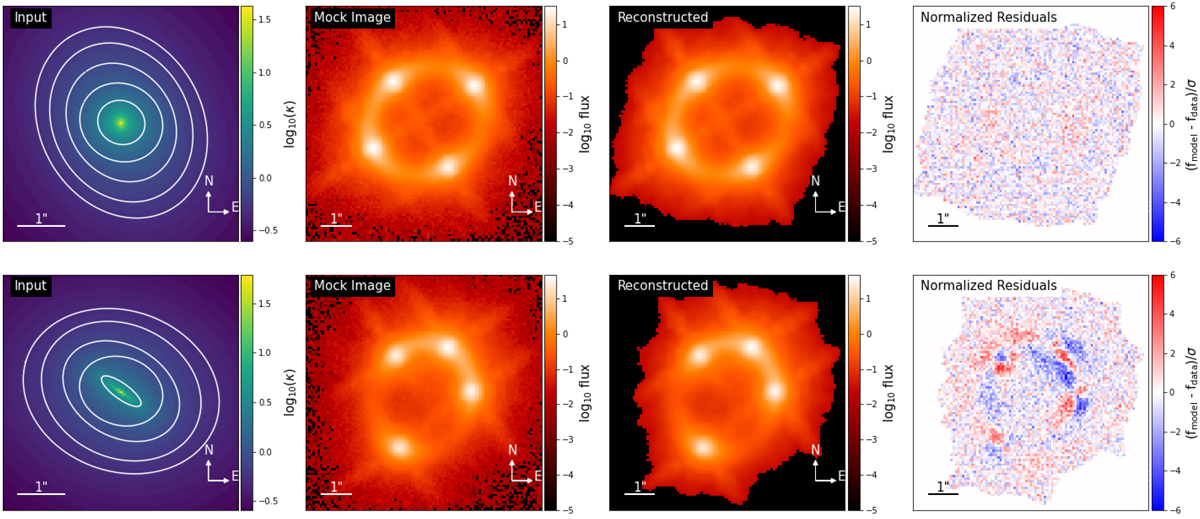
Example of a fit when ellipticity gradients and twists are well absorbed within the model (top) and when these azimuthal variations leave ubiquitous patterns in the residuals (bottom). From left to right: convergence map of the input mass profile displaying twists and ellipticity gradients, mock image created with this mass profile, best power-law + shear model fitting the mock image, and residuals between the image and the model. In most cases, the residuals display no patterns. When extreme changes in ellipticity are displayed in the input mass model, as for ellicular galaxies, the azimuthal variations may not be absorbed by the model. In this case, the residuals display recognisable patterns that are unlikely to be mistaken as lens light or any other well-behaved light component.
Current usage metrics show cumulative count of Article Views (full-text article views including HTML views, PDF and ePub downloads, according to the available data) and Abstracts Views on Vision4Press platform.
Data correspond to usage on the plateform after 2015. The current usage metrics is available 48-96 hours after online publication and is updated daily on week days.
Initial download of the metrics may take a while.