Fig. 1.
Download original image
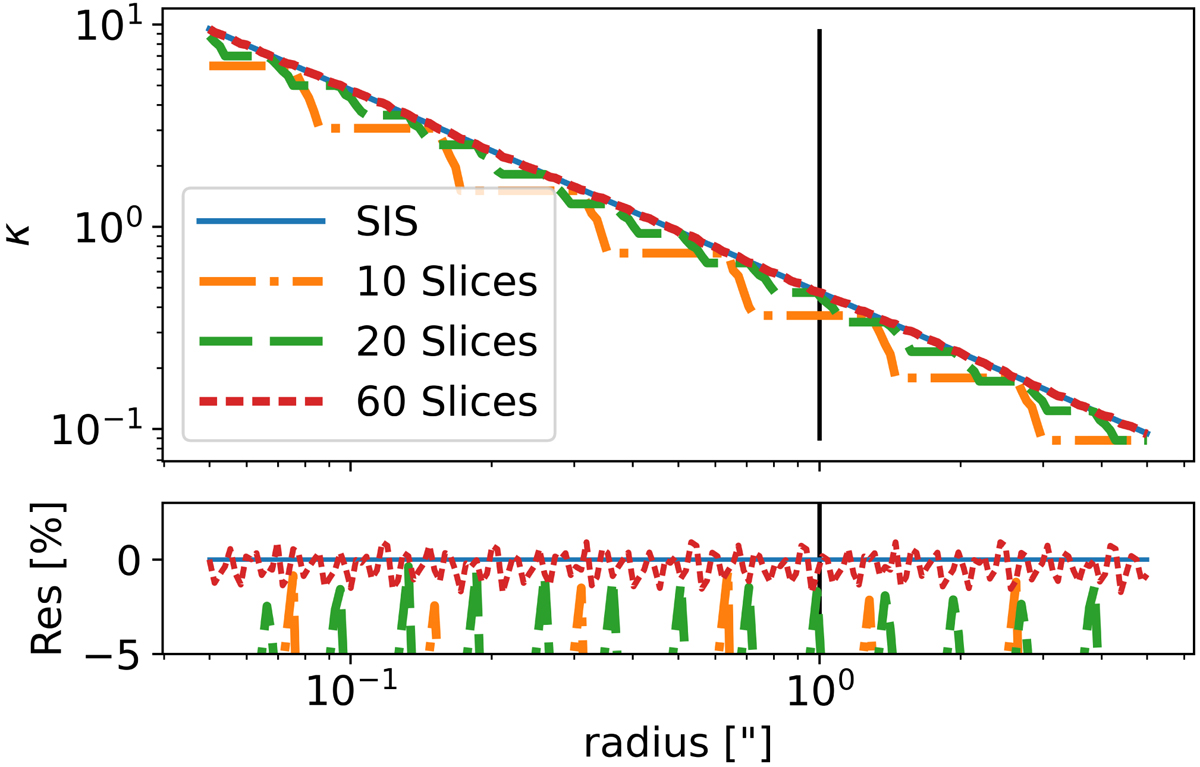
Accuracy of mass profiles created via slices following Schramm (1994) compared to an analytical SIS. Top: Radial convergence profile of a SIS (blue line) and of ‘ElliSLICE’ mass models using 10, 20, or 60 slices (dash-dotted orange line, dashed green line, and densely dashed red line, respectively). Bottom: Residuals in percent between the SIS profile and profiles made of slices. The vertical black line indicates the Einstein radius.
Current usage metrics show cumulative count of Article Views (full-text article views including HTML views, PDF and ePub downloads, according to the available data) and Abstracts Views on Vision4Press platform.
Data correspond to usage on the plateform after 2015. The current usage metrics is available 48-96 hours after online publication and is updated daily on week days.
Initial download of the metrics may take a while.