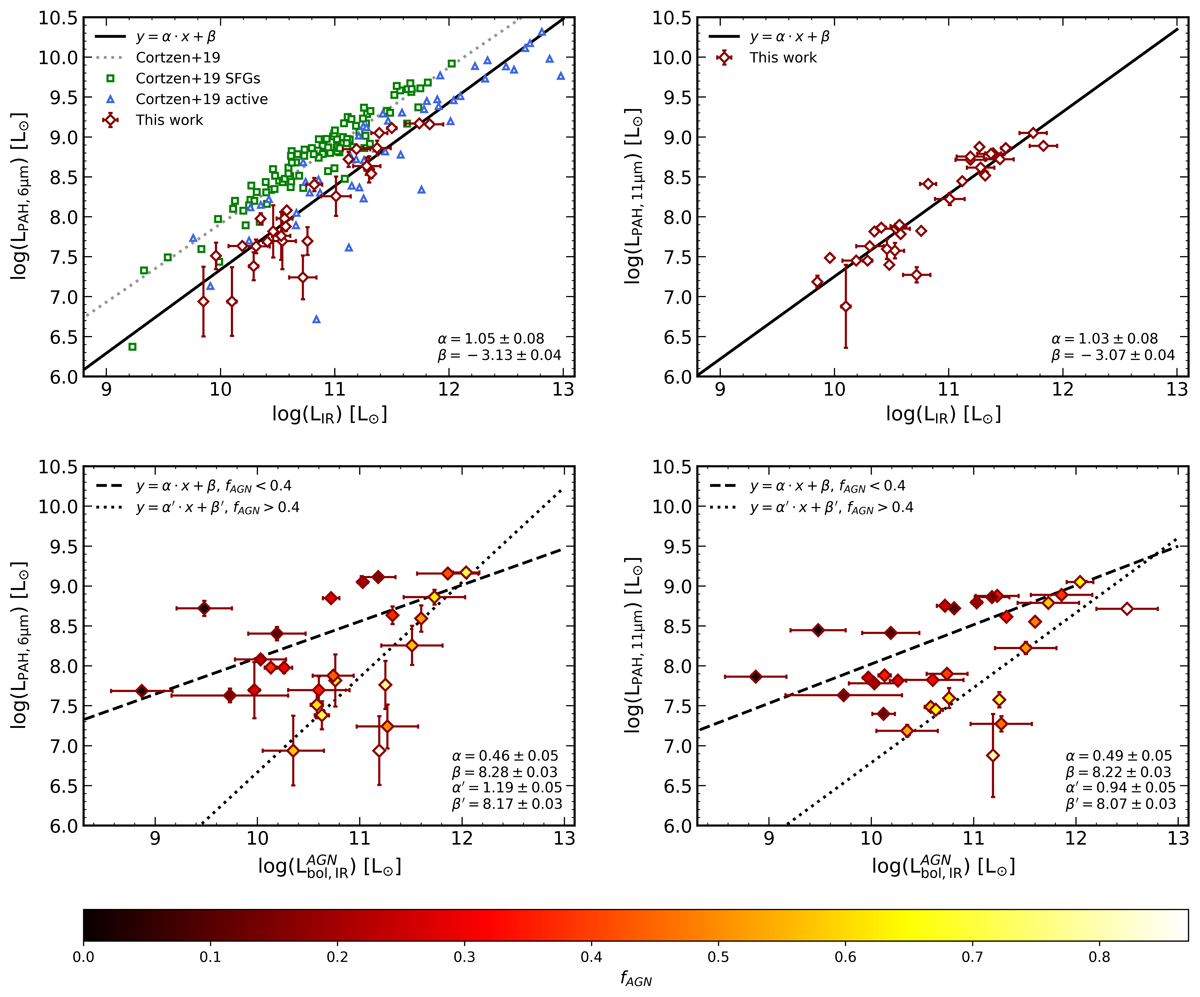
Fig. 8.
Download original image
The emission from PAH features. Top-left panel: 6.2 μm PAH feature luminosity versus infrared luminosity. Seyfert 2 galaxies are shown as red diamonds, and green squares and blue triangles indicate the inactive and active galaxies in the Co19 sample, classified based on the EW of the PAH features at 6.2 and 11.3 μm. The best-fit relation is the solid black line (best-fit parameters are reported in the lower-right corner), and the dotted gray line is the result of the best fit from Co19. Top-right panel: 11.3 μm PAH feature luminosity versus infrared luminosity for the Seyfert 2 galaxies. Points and lines are coded as in the left panel. Bottom panels, from left to right: 6.2 μm and 11.3 μm PAH luminosity, respectively, versus the bolometric luminosity of the AGN, derived from the broadband SED decomposition performed by G16. Data are color-coded as a function of the fraction of the AGN emission with respect to the galaxy global outcome in the 5–40 μm band. Dashed (dotted) lines are the best-fit relation for the subsample of AGN with fAGN < 0.4 (> 0.4).
Current usage metrics show cumulative count of Article Views (full-text article views including HTML views, PDF and ePub downloads, according to the available data) and Abstracts Views on Vision4Press platform.
Data correspond to usage on the plateform after 2015. The current usage metrics is available 48-96 hours after online publication and is updated daily on week days.
Initial download of the metrics may take a while.