Fig. 7.
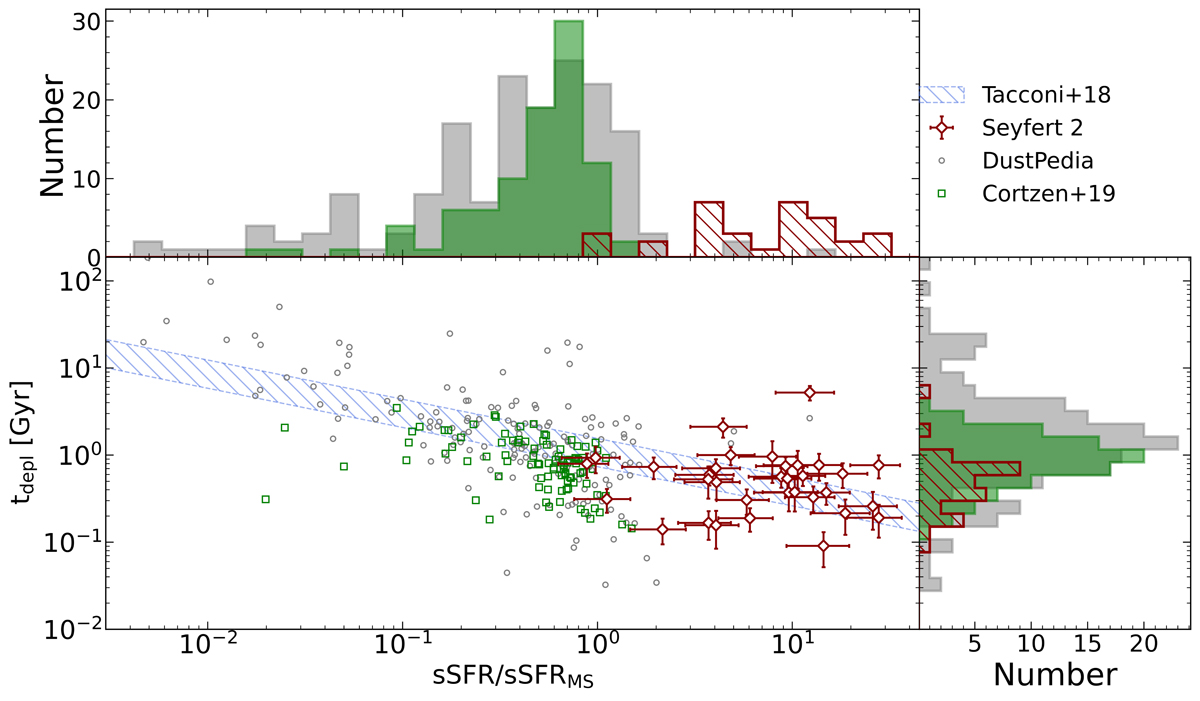
Download original image
Depletion time (in units of Gyr) versus the distance from the MS (δMS) in terms of the sSFR (main panel). The Seyfert 2 galaxies are the red diamonds, and the control sample is shown with the gray circles (DustPedia) and green squares (Co19). The dashed region represents the tdepl − δMS relation from Tacconi et al. (2018) in the interval of the Seyfert 2 galaxy stellar masses and redshifts. Upper and right panels: projected histograms of the distance from the MS and the depletion times, respectively, for the AGN sample and the control sample, following the same color coding.
Current usage metrics show cumulative count of Article Views (full-text article views including HTML views, PDF and ePub downloads, according to the available data) and Abstracts Views on Vision4Press platform.
Data correspond to usage on the plateform after 2015. The current usage metrics is available 48-96 hours after online publication and is updated daily on week days.
Initial download of the metrics may take a while.