Fig. 6.
Download original image
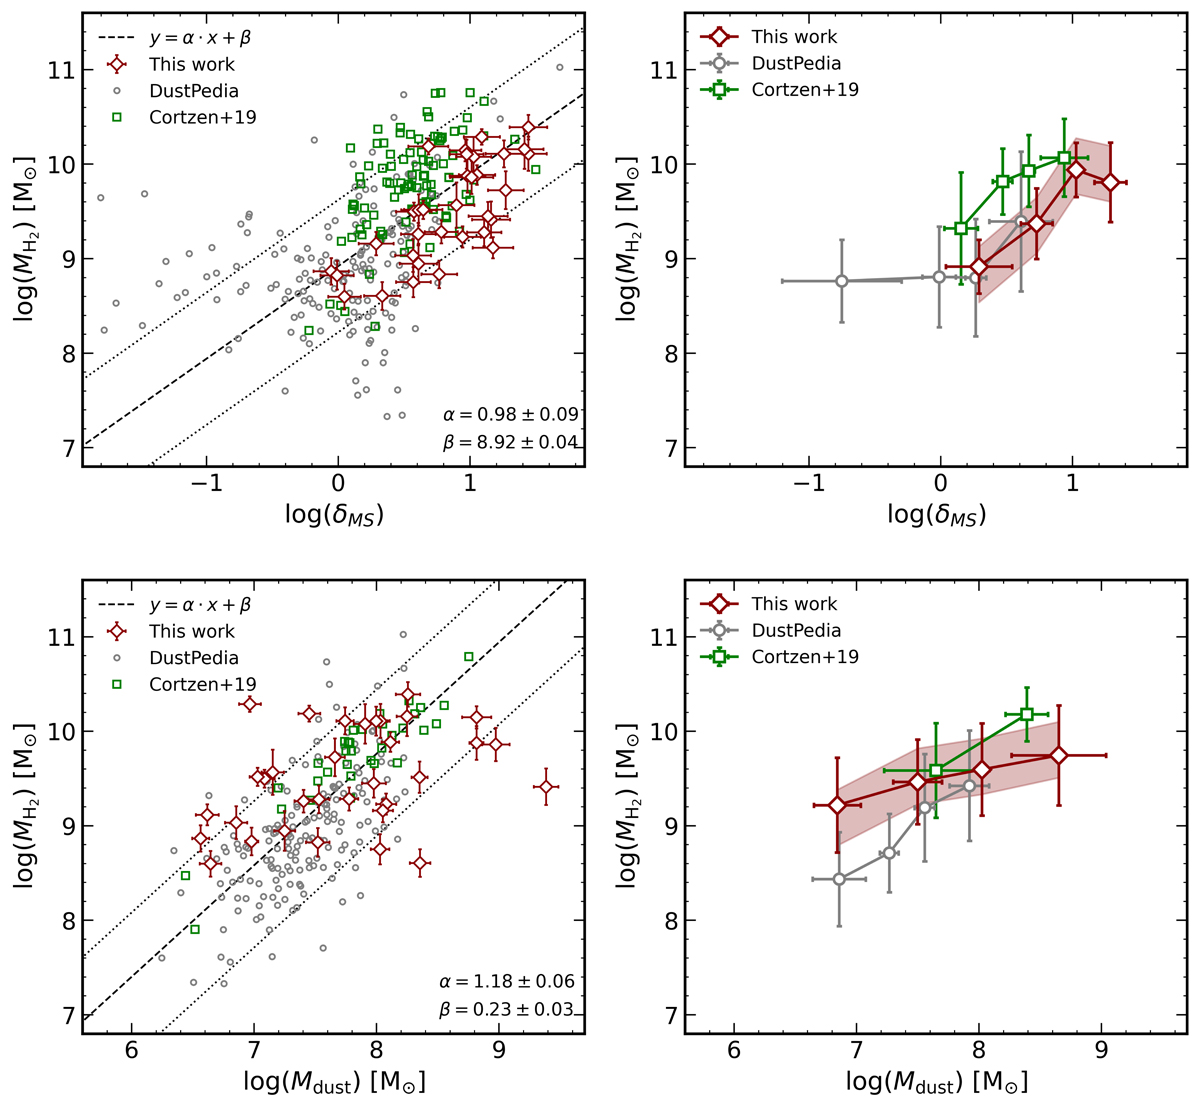
Comparison of the molecular gas properties, part II. Left panels: molecular gas mass (MH2) versus the offset from the MS (derived assuming the relation by Sargent et al. 2014; top panel) and host-galaxy dust mass (Mdust; bottom panel). Seyfert 2 galaxies are shown with red diamonds, and the control sample is represented by gray circles (DustPedia) and green squares (Co19). Bottom panel: we show the MH2 − Mdust diagram, where the MH2 of the 33 5MUSES SFGs were derived from the CO luminosity (Co19), assuming αCO = 4.3 M⊙ pc−2 (K km s−1)−1. We do not represent the entire sample of 5MUSES SFGs since their ![]() are derived from the Mdust assuming a dust-to-gas ratio (GDR). For purely illustrative purposes, the best-fit trend (dashed black line) for the control sample of inactive galaxies is shown, and the two dotted black lines are the same trend shifted by a factor of 0.5 dex in either direction. The best-fit slope (α) and normalization (β) are reported in each panel. Right column: same scaling relations presented on the left, but with binned values (using the same method as in Fig. 5). The red-shaded regions are as described in Fig. 5.
are derived from the Mdust assuming a dust-to-gas ratio (GDR). For purely illustrative purposes, the best-fit trend (dashed black line) for the control sample of inactive galaxies is shown, and the two dotted black lines are the same trend shifted by a factor of 0.5 dex in either direction. The best-fit slope (α) and normalization (β) are reported in each panel. Right column: same scaling relations presented on the left, but with binned values (using the same method as in Fig. 5). The red-shaded regions are as described in Fig. 5.
Current usage metrics show cumulative count of Article Views (full-text article views including HTML views, PDF and ePub downloads, according to the available data) and Abstracts Views on Vision4Press platform.
Data correspond to usage on the plateform after 2015. The current usage metrics is available 48-96 hours after online publication and is updated daily on week days.
Initial download of the metrics may take a while.