Fig. 5.
Download original image
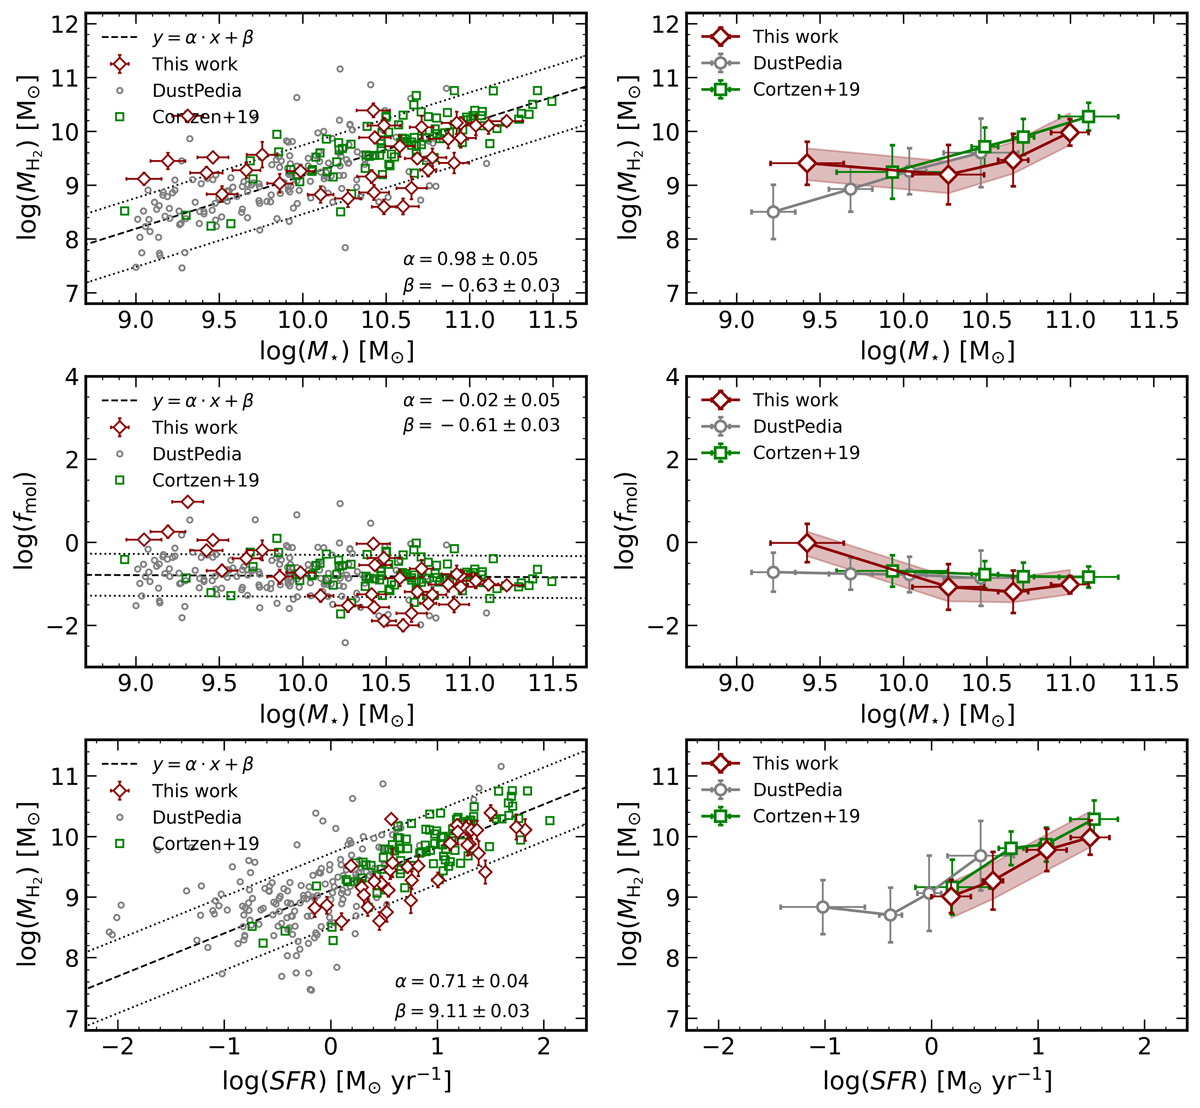
Comparison of the molecular gas properties, part I. Left panels: scaling relations of the molecular gas mass (MH2) as a function of the host-galaxy stellar mass (M⋆; top row) and SFR (bottom row); in the central panel, we show the molecular gas fraction (fmol = MH2/M⋆) as a function of M⋆. Seyfert 2 galaxies are shown as red diamonds, and the control sample is represented by gray circles (DustPedia) and green squares (5MUSES). For purely illustrative purposes, the best-fit trend (dashed black line) for the control sample of inactive galaxies is shown, and the two dotted black lines are the same trend shifted by a factor of 0.5 dex in either direction. The best-fit slope (α) and normalization (β) are reported in each panel. Right panels: same scaling relations as in the left panels, but with binned data to underline the average trend of active and inactive galaxies. The red-shaded regions represent the range of ![]() values of AGN obtained assuming an αCO in the range between the Milky Way-like value (αCO = 4.3 M⊙ pc−2 (K km s−1)−1) and αCO = 1.1 M⊙ pc−2 (K km s−1)−1, typically used for the central region of local AGN (see the main text for further details). The bins were chosen to include the same number of sources. The mean value and error bars (standard deviations) in each bin were determined with a bootstrap procedure using 10 000 iterations.
values of AGN obtained assuming an αCO in the range between the Milky Way-like value (αCO = 4.3 M⊙ pc−2 (K km s−1)−1) and αCO = 1.1 M⊙ pc−2 (K km s−1)−1, typically used for the central region of local AGN (see the main text for further details). The bins were chosen to include the same number of sources. The mean value and error bars (standard deviations) in each bin were determined with a bootstrap procedure using 10 000 iterations.
Current usage metrics show cumulative count of Article Views (full-text article views including HTML views, PDF and ePub downloads, according to the available data) and Abstracts Views on Vision4Press platform.
Data correspond to usage on the plateform after 2015. The current usage metrics is available 48-96 hours after online publication and is updated daily on week days.
Initial download of the metrics may take a while.