Fig. 4.
Download original image
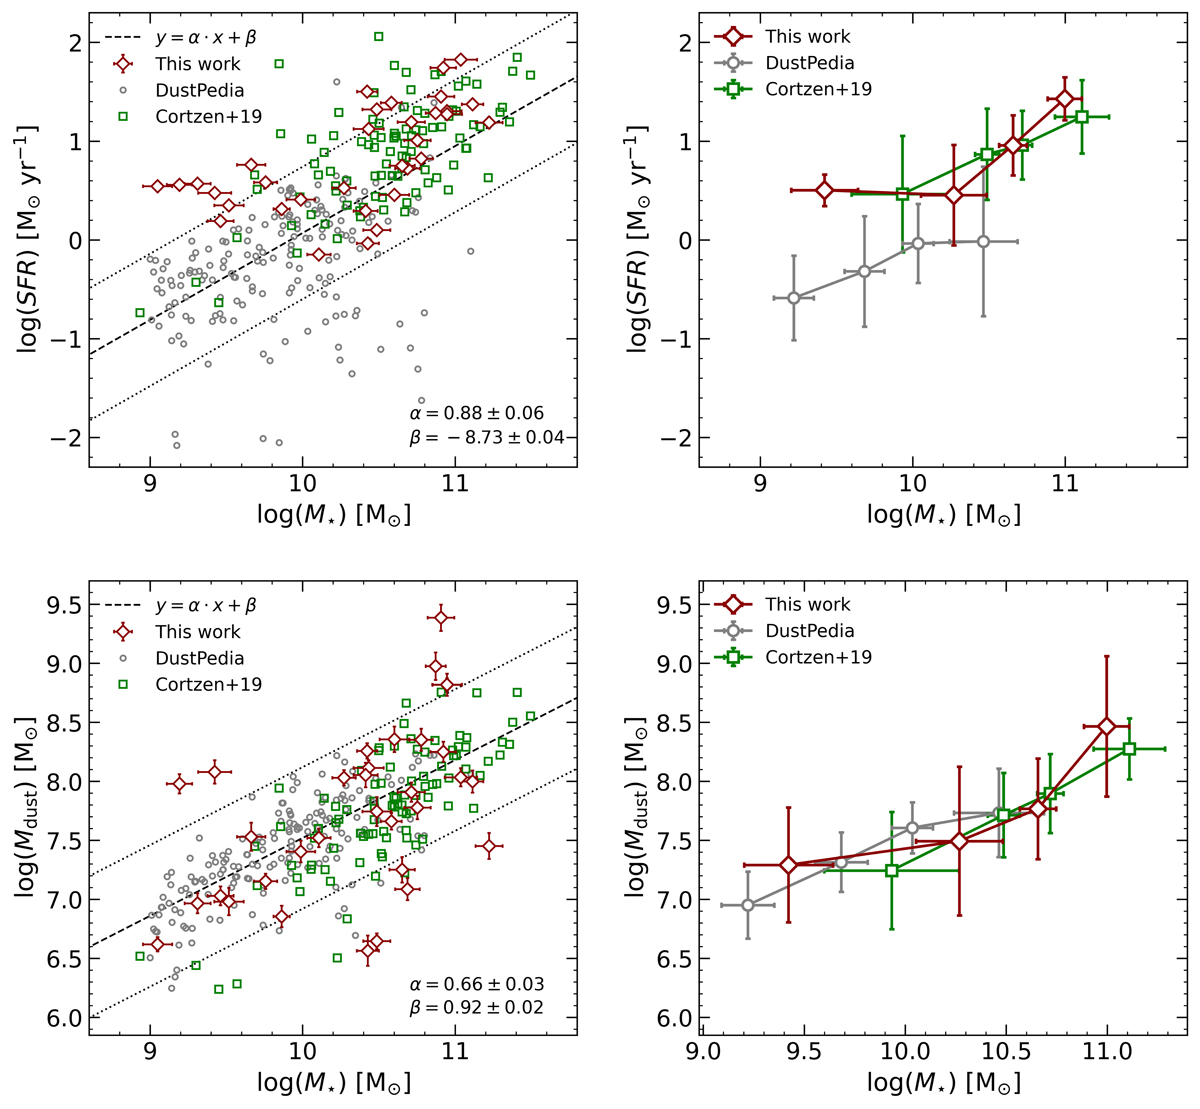
Properties of the Seyfert 2 galaxies and control samples. Left panels: SFR (top row) and dust mass (bottom row) as a function of the stellar mass (M⋆) for Seyfert 2 galaxies (red diamonds) and the control sample (gray circles for DustPedia galaxies and green squares for 5MUSES sources). For purely illustrative purposes, the best-fit trend (dashed black line) for the control sample of inactive galaxies is shown, and the two dotted black lines are the same trend shifted by a factor of 0.5 dex in either direction. The best-fit slope (α) and normalization (β) are reported in each panel. Right panels: same SFR-M⋆ and Mdust − M⋆ planes as in the left panels, but with binned data to underline the average trend of active and inactive galaxies. The bins were chosen to include the same number of sources. The mean value and the error bars (standard deviations) in each bin were determined with a bootstrap procedure using 10 000 iterations.
Current usage metrics show cumulative count of Article Views (full-text article views including HTML views, PDF and ePub downloads, according to the available data) and Abstracts Views on Vision4Press platform.
Data correspond to usage on the plateform after 2015. The current usage metrics is available 48-96 hours after online publication and is updated daily on week days.
Initial download of the metrics may take a while.