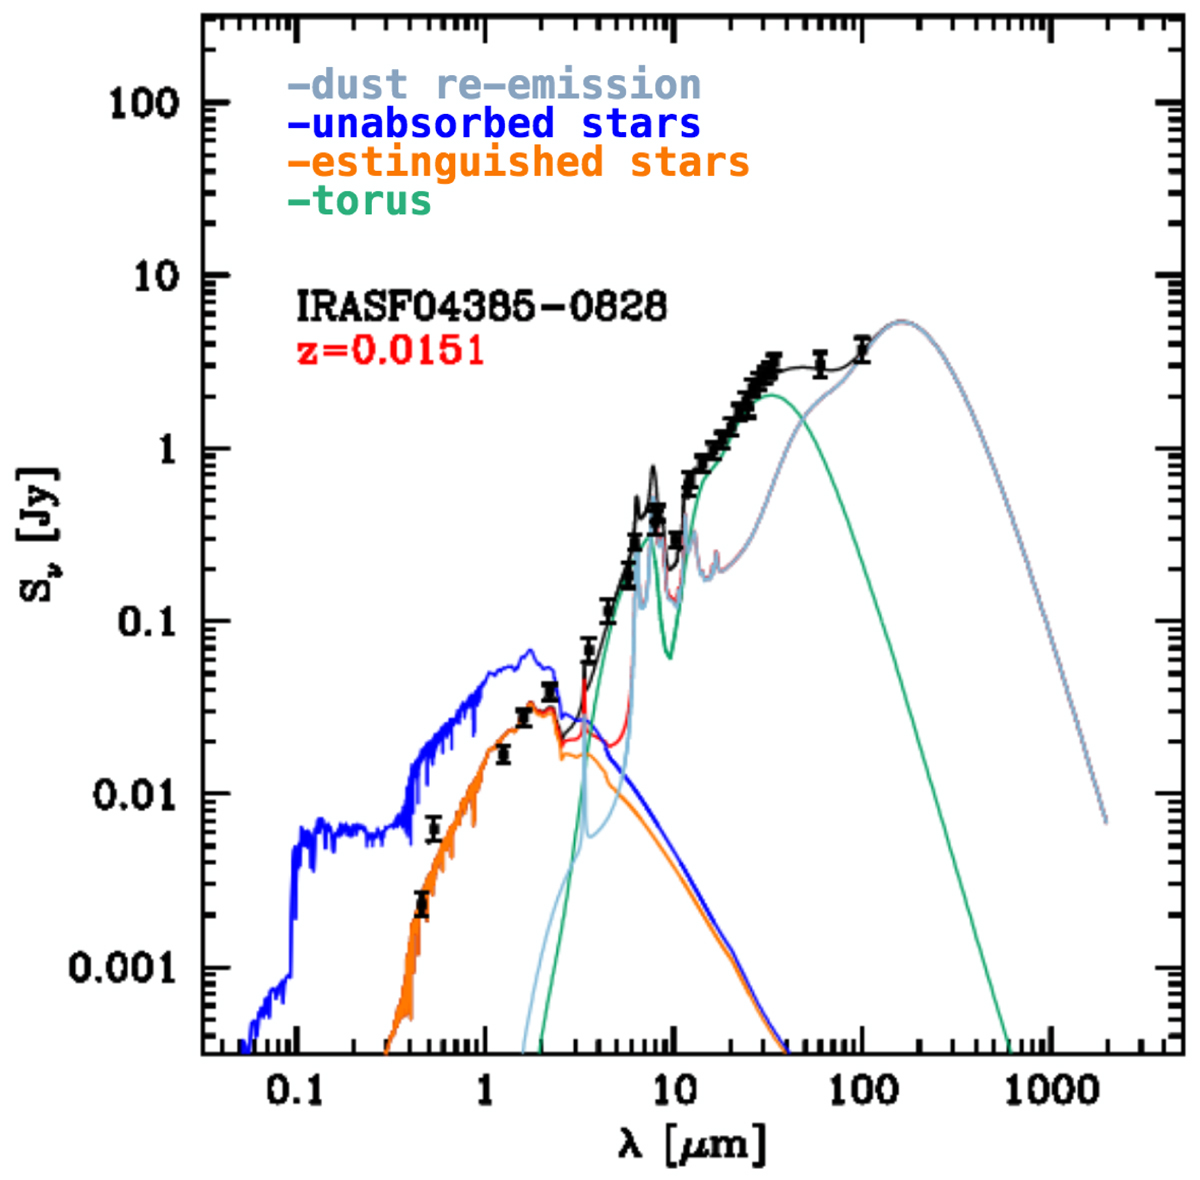
Fig. 3.
Download original image
Example of a decomposed SED (from G16). The unabsorbed stellar component (blue line) is scaled down due to the dust absorption to match observations (black dots). The resulting absorbed stellar emission is represented in orange. In the MIR band, the dusty torus component is shown with the dashed green line, and the dust reemission in the FIR is in gray.
Current usage metrics show cumulative count of Article Views (full-text article views including HTML views, PDF and ePub downloads, according to the available data) and Abstracts Views on Vision4Press platform.
Data correspond to usage on the plateform after 2015. The current usage metrics is available 48-96 hours after online publication and is updated daily on week days.
Initial download of the metrics may take a while.