Fig. A.1.
Download original image
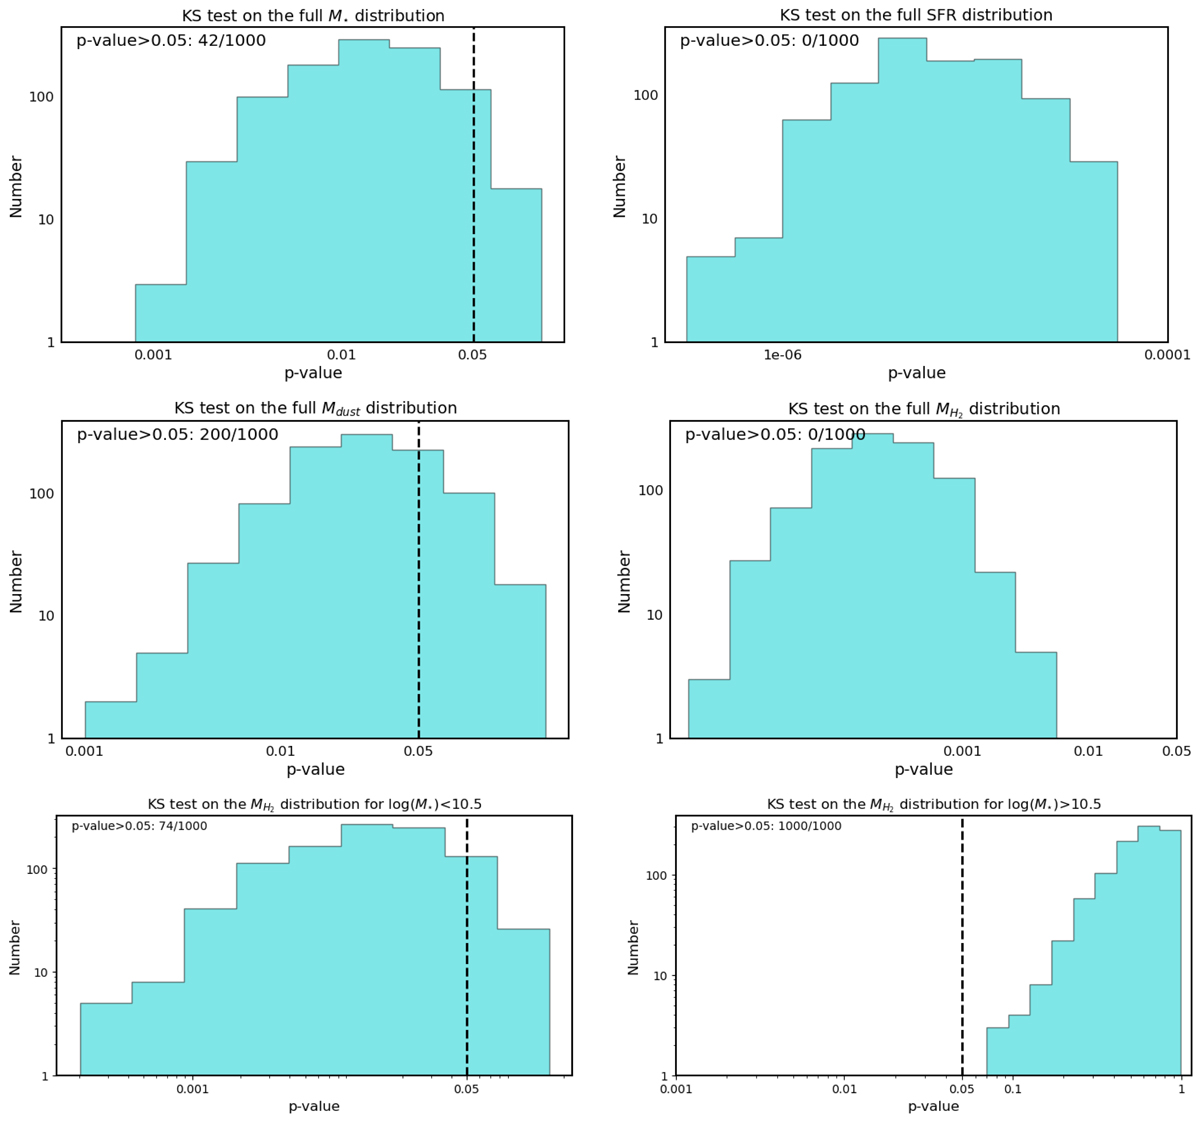
KS tests: results. Upper panels: Histograms of the p-values of the KS test performed on the simulated M⋆ (left panel) and SFR (right panel) distributions of AGN and the control sample of SFGs. On the y axis, the logarithm of the number of entries is divided into ten equally log-spaced bins, and the p-values resulting from the 1000 KS tests are reported on the x axis. The threshold above which we cannot reject the null hypothesis that the samples are drawn from the same distribution is represented by a vertical, dashed black line at p = 0.05. Central panels: Same as the upper row, but with Mdust (left panel) and ![]() (right panel) distributions. Bottom panels: Results of the KS tests on the
(right panel) distributions. Bottom panels: Results of the KS tests on the ![]() distribution in the log(M⋆) < 10.5 M⊙ (left panel) and log(M⋆) > 10.5 M⊙ (right panel) regimes.
distribution in the log(M⋆) < 10.5 M⊙ (left panel) and log(M⋆) > 10.5 M⊙ (right panel) regimes.
Current usage metrics show cumulative count of Article Views (full-text article views including HTML views, PDF and ePub downloads, according to the available data) and Abstracts Views on Vision4Press platform.
Data correspond to usage on the plateform after 2015. The current usage metrics is available 48-96 hours after online publication and is updated daily on week days.
Initial download of the metrics may take a while.