Fig. 1.
Download original image
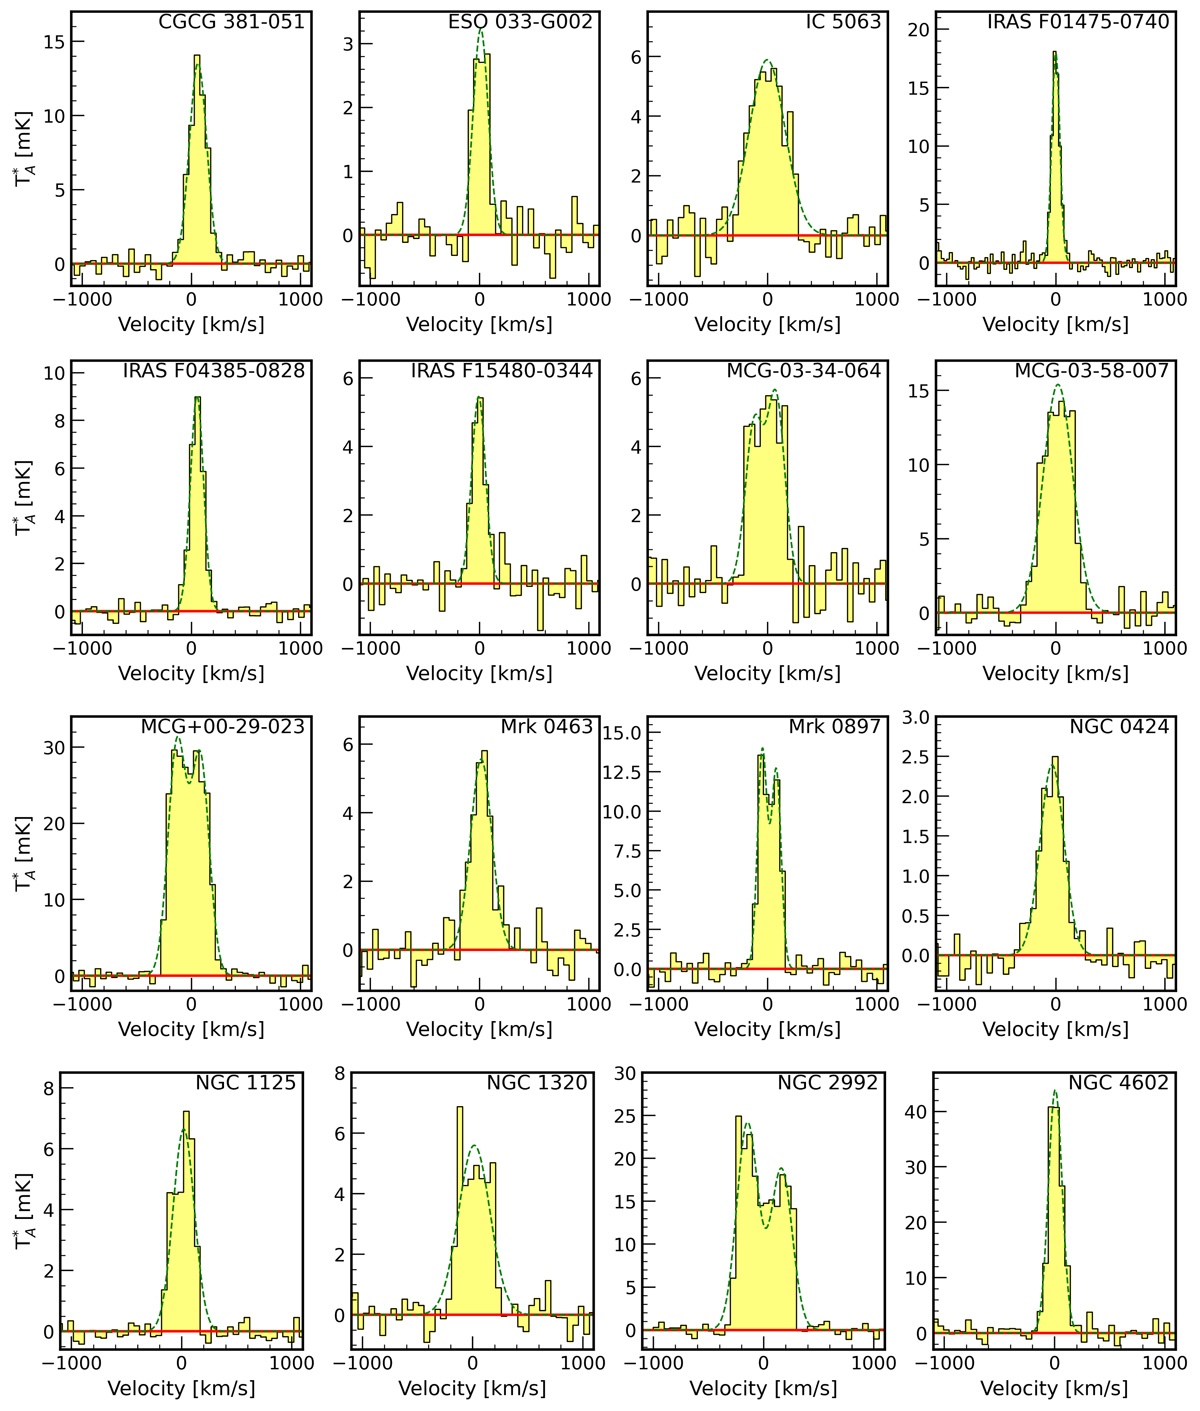
Continuum-subtracted CO(2–1) emission line profile for 23 Seyfert 2 galaxies observed by APEX. Fluxes are expressed as antenna temperatures (![]() , in units of mK), and the spectral axis is in velocity units (km s−1), calculated with respect to the expected CO(2–1) sky frequency at the redshift of each source, assuming the radio conversion for the velocity. Each panel spans a fixed range of 2000 km s−1 in velocity around the systemic velocity of the galaxy to allow a simple visual comparison of the kinematics of the lines. The CO(2–1) emission is clearly detected in all observations, with at least S/N = 4 in the channel corresponding to the peak of the line profile. The dashed green line represents the best-fit function, which consists of one or two Gaussian functions, depending on the spectral line profile; the solid red line represents the zero K level.
, in units of mK), and the spectral axis is in velocity units (km s−1), calculated with respect to the expected CO(2–1) sky frequency at the redshift of each source, assuming the radio conversion for the velocity. Each panel spans a fixed range of 2000 km s−1 in velocity around the systemic velocity of the galaxy to allow a simple visual comparison of the kinematics of the lines. The CO(2–1) emission is clearly detected in all observations, with at least S/N = 4 in the channel corresponding to the peak of the line profile. The dashed green line represents the best-fit function, which consists of one or two Gaussian functions, depending on the spectral line profile; the solid red line represents the zero K level.
Current usage metrics show cumulative count of Article Views (full-text article views including HTML views, PDF and ePub downloads, according to the available data) and Abstracts Views on Vision4Press platform.
Data correspond to usage on the plateform after 2015. The current usage metrics is available 48-96 hours after online publication and is updated daily on week days.
Initial download of the metrics may take a while.