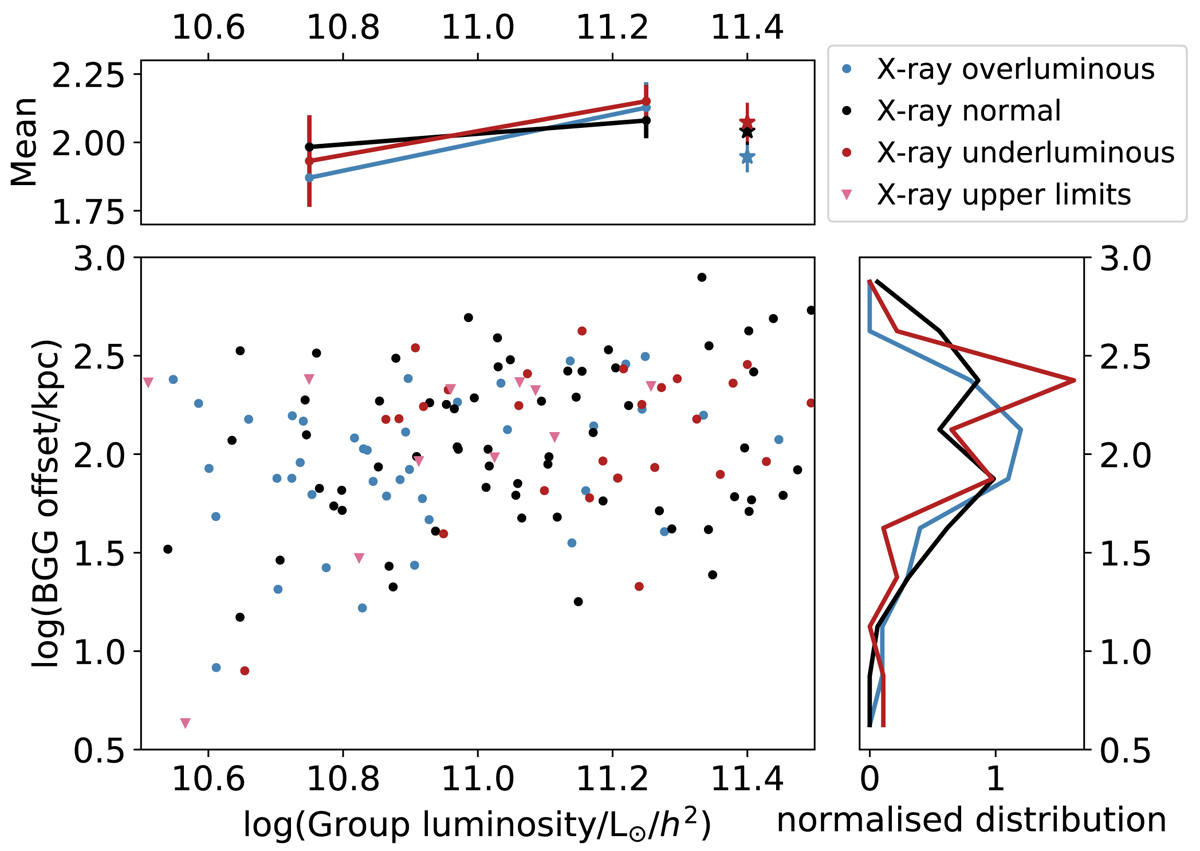
Fig. 8.
Download original image
Values of the offset of the central galaxy from the optical luminosity weighted centre for each member of the X-ray overluminous (blue), X-ray normal (black), and X-ray underluminous (red) sub-samples. Underluminous groups with X-ray upper limits are denoted with a light red triangle. The main panel shows the values for each group, while the right panel shows the distribution of central galaxy offset for each of the sub-samples. The top panel shows the sub-sample means, both across the full range in Lopt (stars) and split into two bins in Lopt (circles). X-ray underluminous systems have, on average, larger offsets than the X-ray overluminous groups.
Current usage metrics show cumulative count of Article Views (full-text article views including HTML views, PDF and ePub downloads, according to the available data) and Abstracts Views on Vision4Press platform.
Data correspond to usage on the plateform after 2015. The current usage metrics is available 48-96 hours after online publication and is updated daily on week days.
Initial download of the metrics may take a while.