Fig. 5.
Download original image
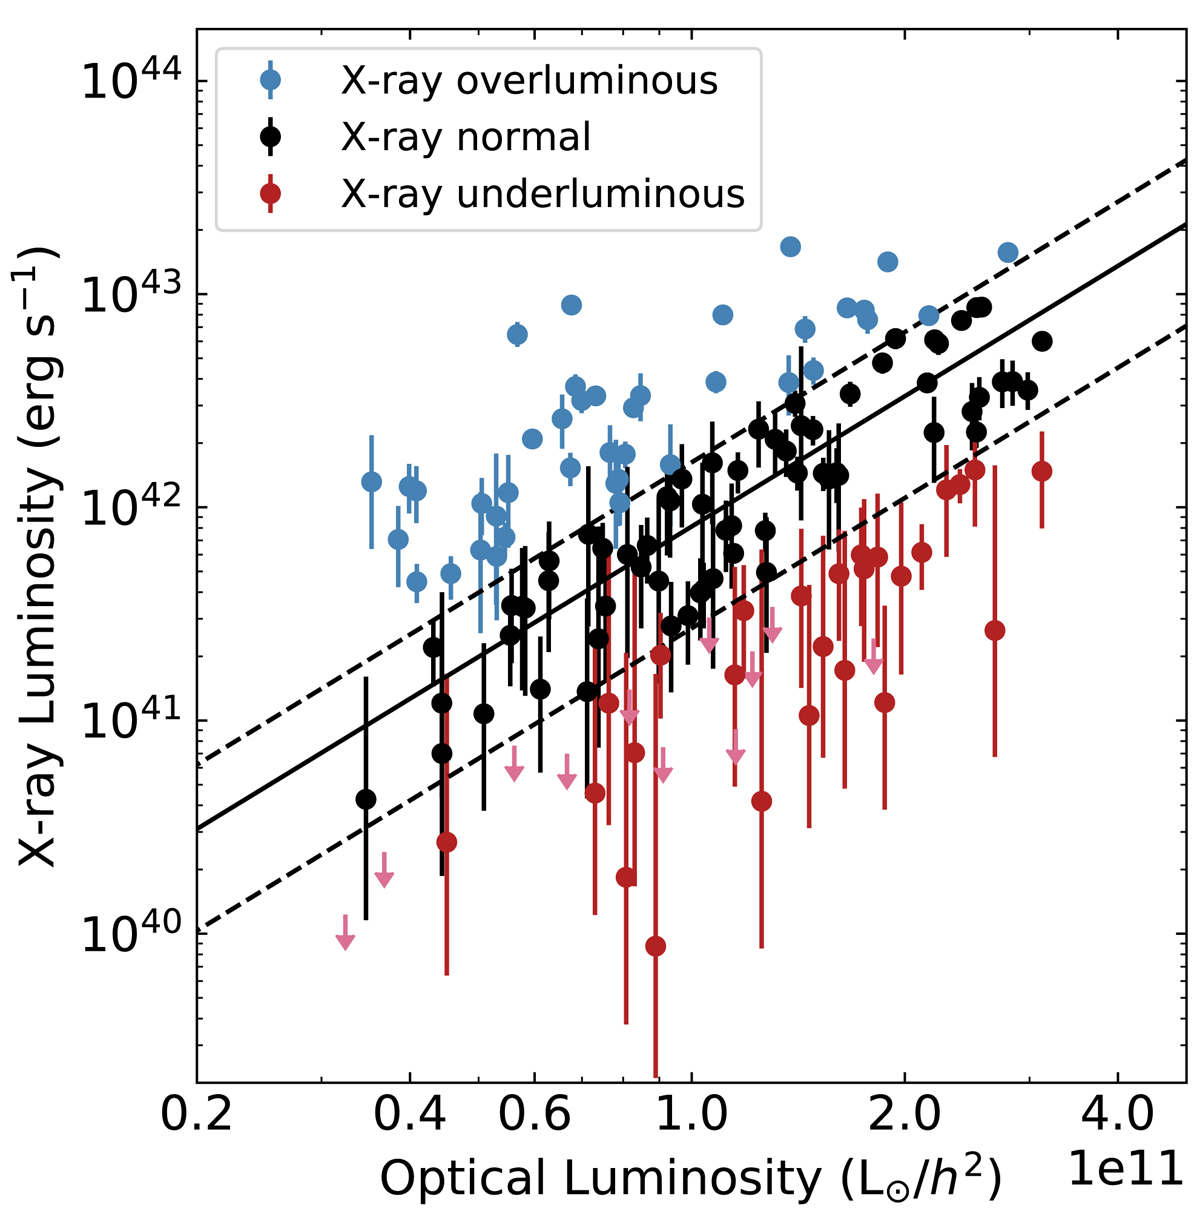
![]() vs. Lopt for all groups in our final sample, with 1σ uncertainties shown. The trend line from Fig. 4 is shown as a solid black line. The dashed lines show the thresholds used in creating our X-ray overluminous and X-ray underluminous samples. These lines are a factor of 2 above and 3 below the best fit line, respectively. These values were chosen to achieve comparable numbers of groups in the bright and dim samples. More discussion on different choices for this selection can be found in Sect. 5.
vs. Lopt for all groups in our final sample, with 1σ uncertainties shown. The trend line from Fig. 4 is shown as a solid black line. The dashed lines show the thresholds used in creating our X-ray overluminous and X-ray underluminous samples. These lines are a factor of 2 above and 3 below the best fit line, respectively. These values were chosen to achieve comparable numbers of groups in the bright and dim samples. More discussion on different choices for this selection can be found in Sect. 5.
Current usage metrics show cumulative count of Article Views (full-text article views including HTML views, PDF and ePub downloads, according to the available data) and Abstracts Views on Vision4Press platform.
Data correspond to usage on the plateform after 2015. The current usage metrics is available 48-96 hours after online publication and is updated daily on week days.
Initial download of the metrics may take a while.