Fig. 3.
Download original image
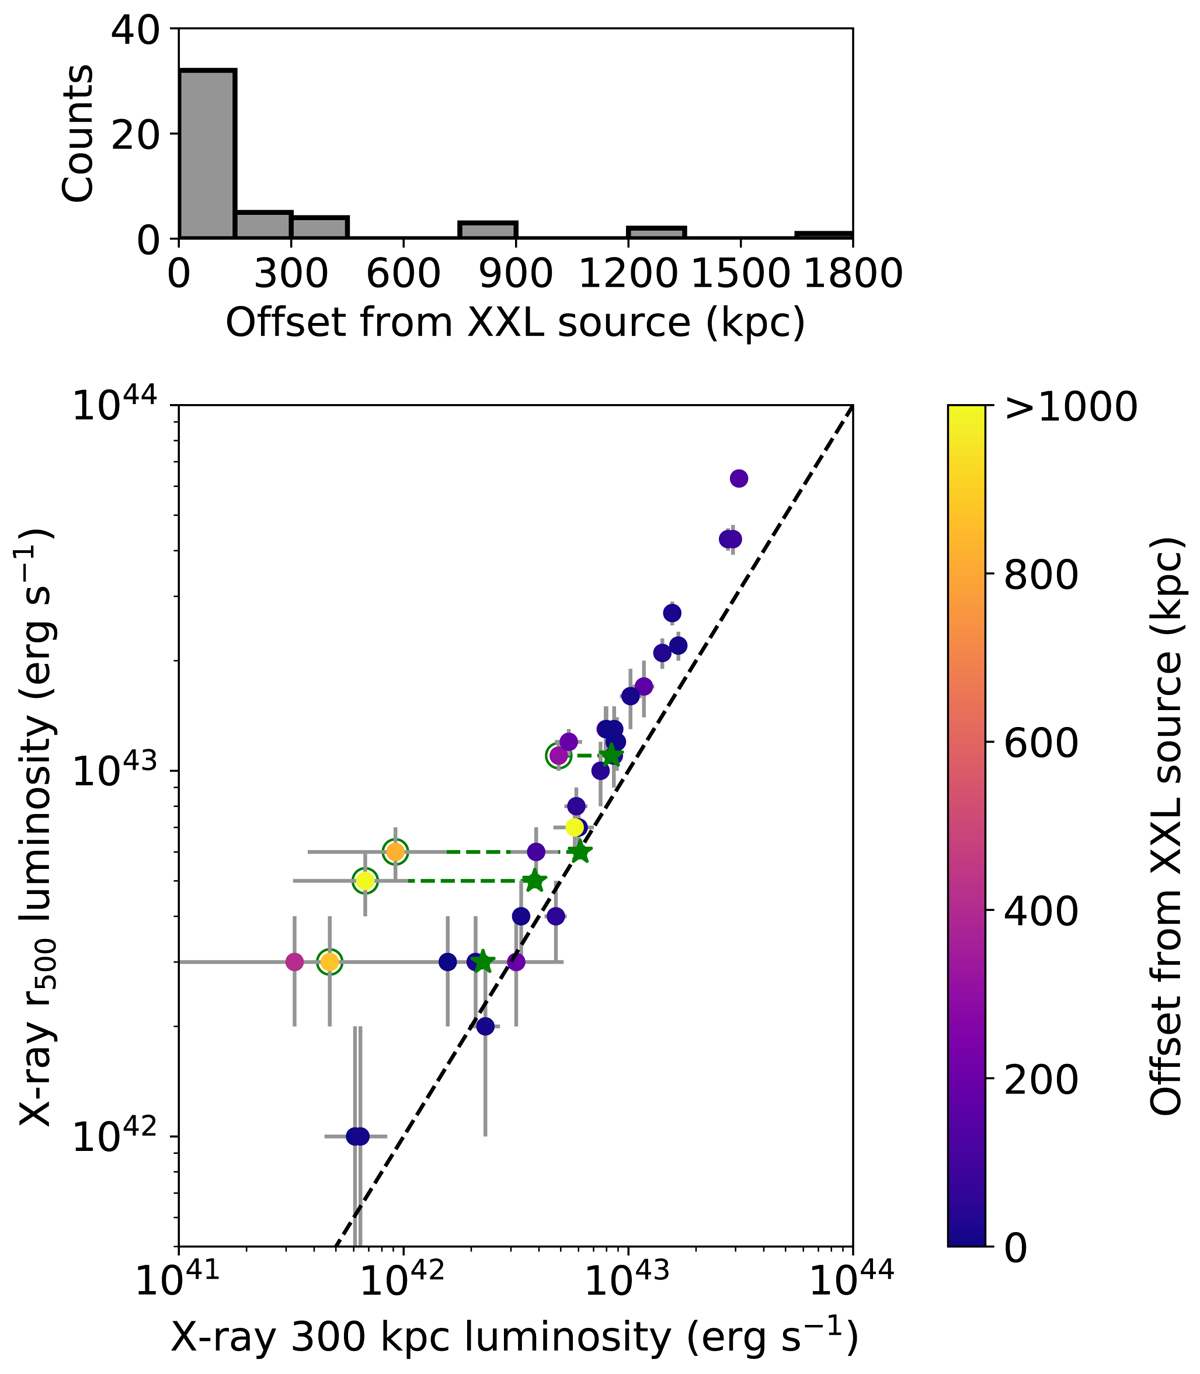
XXL-derived [0.5 − 2] keV ![]() from XXL Paper XX plotted against our aperture [0.5 − 2] keV
from XXL Paper XX plotted against our aperture [0.5 − 2] keV ![]() for the matched groups in our sample, with 1σ uncertainties shown. The colour bar displays the 2D projected sky offset between the GAMA group centre and the XXL X-ray position. The dotted black line denotes a 1:1 match. The two X-ray luminosity measurements are similar in most cases, except when there is a large offset between the XXL source position and the optical group centre. Green stars show re-measured
for the matched groups in our sample, with 1σ uncertainties shown. The colour bar displays the 2D projected sky offset between the GAMA group centre and the XXL X-ray position. The dotted black line denotes a 1:1 match. The two X-ray luminosity measurements are similar in most cases, except when there is a large offset between the XXL source position and the optical group centre. Green stars show re-measured ![]() values for groups where a catalogue XXL source overlaps with a prominent non-central GAMA group member (see Sect. 2.3.2 for details). They are connected to the original values by a green line.
values for groups where a catalogue XXL source overlaps with a prominent non-central GAMA group member (see Sect. 2.3.2 for details). They are connected to the original values by a green line.
Current usage metrics show cumulative count of Article Views (full-text article views including HTML views, PDF and ePub downloads, according to the available data) and Abstracts Views on Vision4Press platform.
Data correspond to usage on the plateform after 2015. The current usage metrics is available 48-96 hours after online publication and is updated daily on week days.
Initial download of the metrics may take a while.