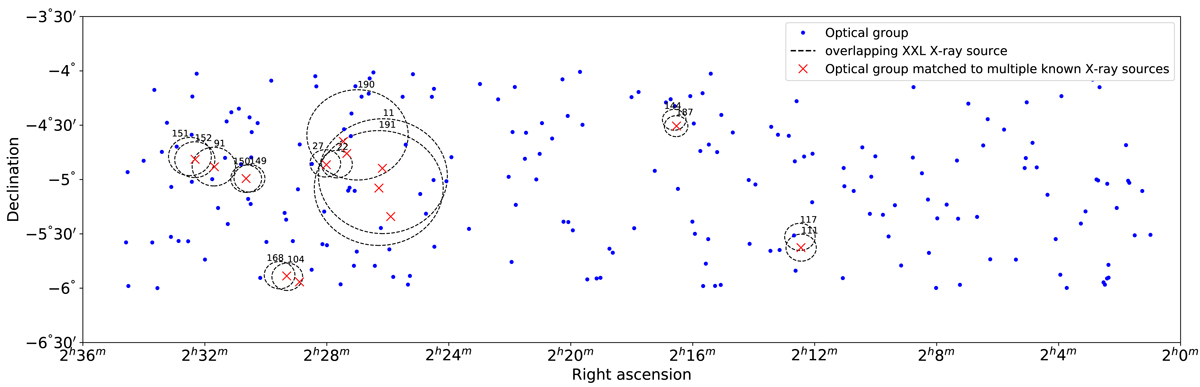
Fig. 2.
Download original image
Positions of the GAMA FoF groups compared to X-ray cluster complexes. X-ray clusters from XXL Paper XX that overlap one another within 5000 km s−1 and 2 Mpc are shown as black dashed circles with a radius of 2 Mpc at the X-ray source redshift. Red crosses show the positions of GAMA groups that match to these X-ray sources in redshift space. These systems may be infalling or merging into cluster complexes, which may affect their properties. They have therefore been excluded from our analysis.
Current usage metrics show cumulative count of Article Views (full-text article views including HTML views, PDF and ePub downloads, according to the available data) and Abstracts Views on Vision4Press platform.
Data correspond to usage on the plateform after 2015. The current usage metrics is available 48-96 hours after online publication and is updated daily on week days.
Initial download of the metrics may take a while.