Fig. 16.
Download original image
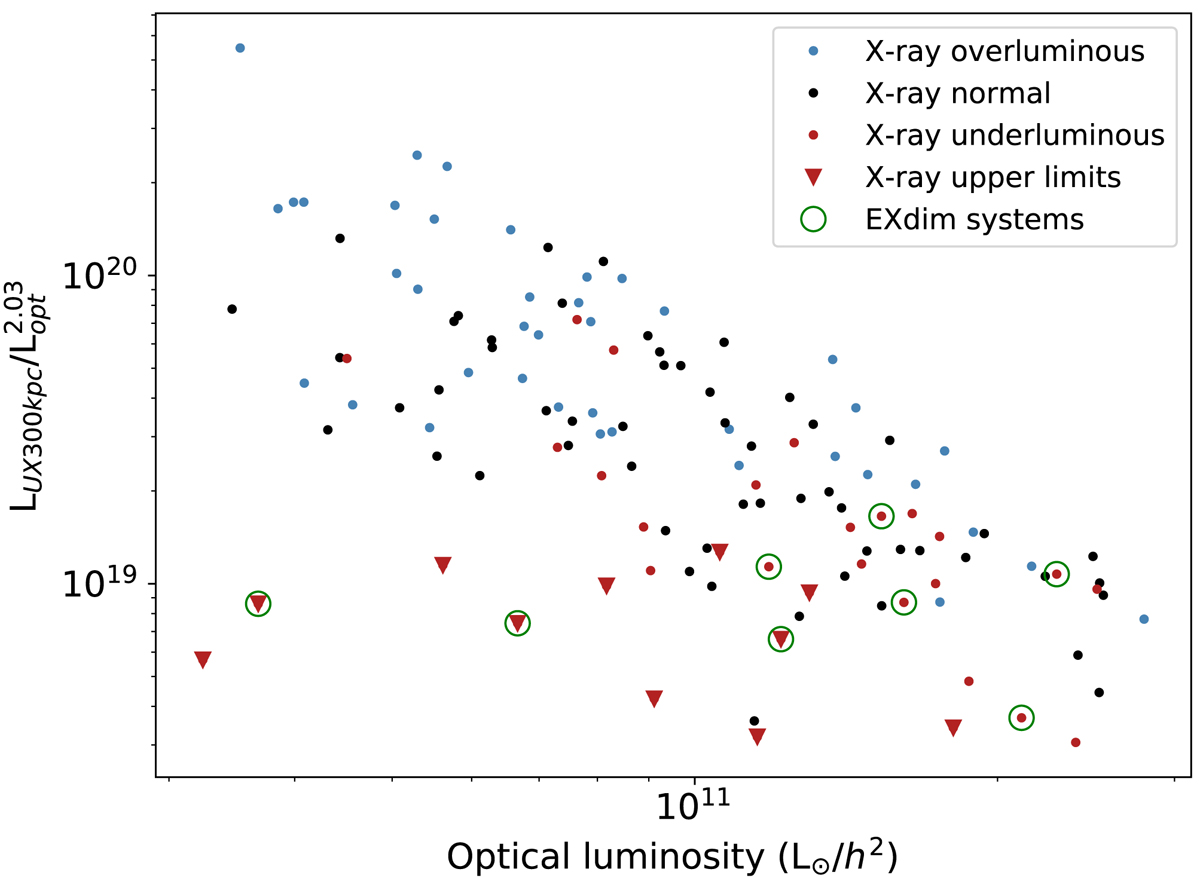
Ratio of LUX300 kpc/![]() (UXO) plotted against Lopt for all groups. Blue, black, and red colours denote groups in the X-ray overluminous, normal, and underluminous subsamples. Inverted triangles denote X-ray upper limits, where no significant X-ray flux value was detected. We highlight X-ray underluminous systems with properties suggesting an evolved group (called here EXdim groups) with green circles. If these groups are dynamically evolved, their low X-ray emission must have some other cause.
(UXO) plotted against Lopt for all groups. Blue, black, and red colours denote groups in the X-ray overluminous, normal, and underluminous subsamples. Inverted triangles denote X-ray upper limits, where no significant X-ray flux value was detected. We highlight X-ray underluminous systems with properties suggesting an evolved group (called here EXdim groups) with green circles. If these groups are dynamically evolved, their low X-ray emission must have some other cause.
Current usage metrics show cumulative count of Article Views (full-text article views including HTML views, PDF and ePub downloads, according to the available data) and Abstracts Views on Vision4Press platform.
Data correspond to usage on the plateform after 2015. The current usage metrics is available 48-96 hours after online publication and is updated daily on week days.
Initial download of the metrics may take a while.