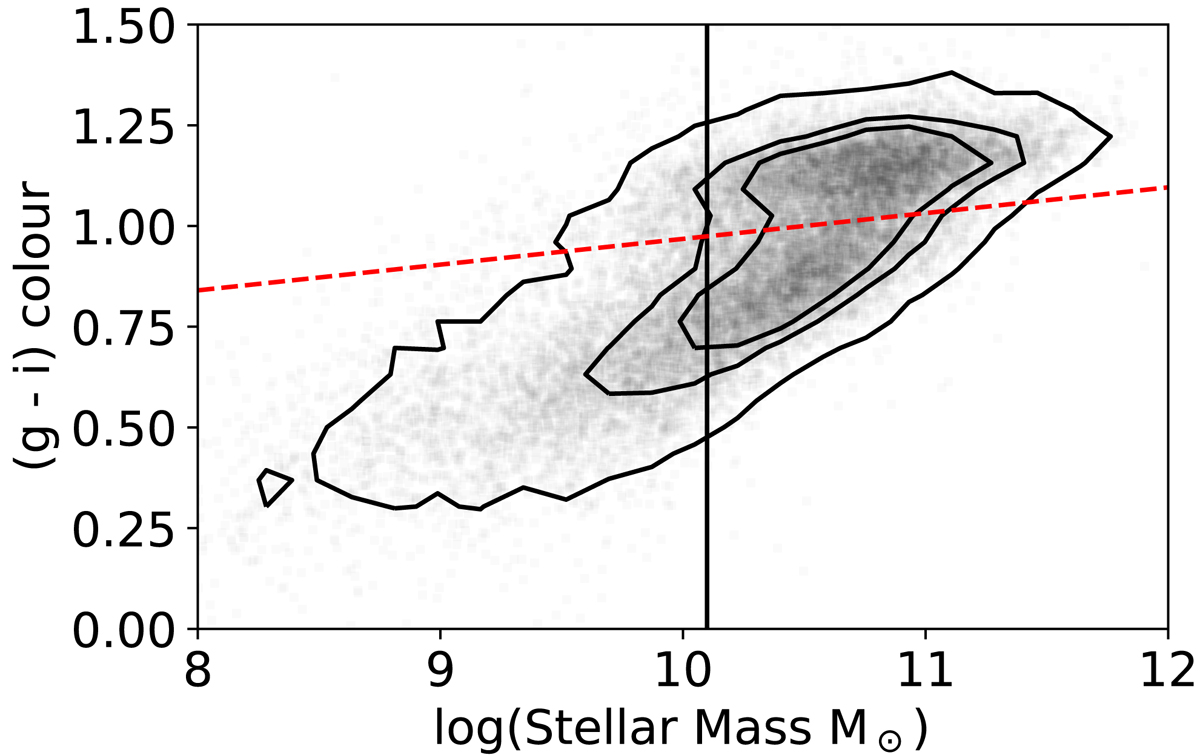
Fig. 11.
Download original image
(g − i) colour vs. stellar mass diagram for all galaxies in the GAMA G02-XXL overlap region. The red line denotes a linear fit calculated by fitting Gaussian curves to the red and blue populations. We consider galaxies as blue if they lie below the linear fit, and red if they lie above it. The solid black line denotes the mean mass of the ten faintest galaxies to our Mr = −21.1 mag limit, corresponding to log(Mstellar/M⊙)≈10.10.
Current usage metrics show cumulative count of Article Views (full-text article views including HTML views, PDF and ePub downloads, according to the available data) and Abstracts Views on Vision4Press platform.
Data correspond to usage on the plateform after 2015. The current usage metrics is available 48-96 hours after online publication and is updated daily on week days.
Initial download of the metrics may take a while.