Fig. 10.
Download original image
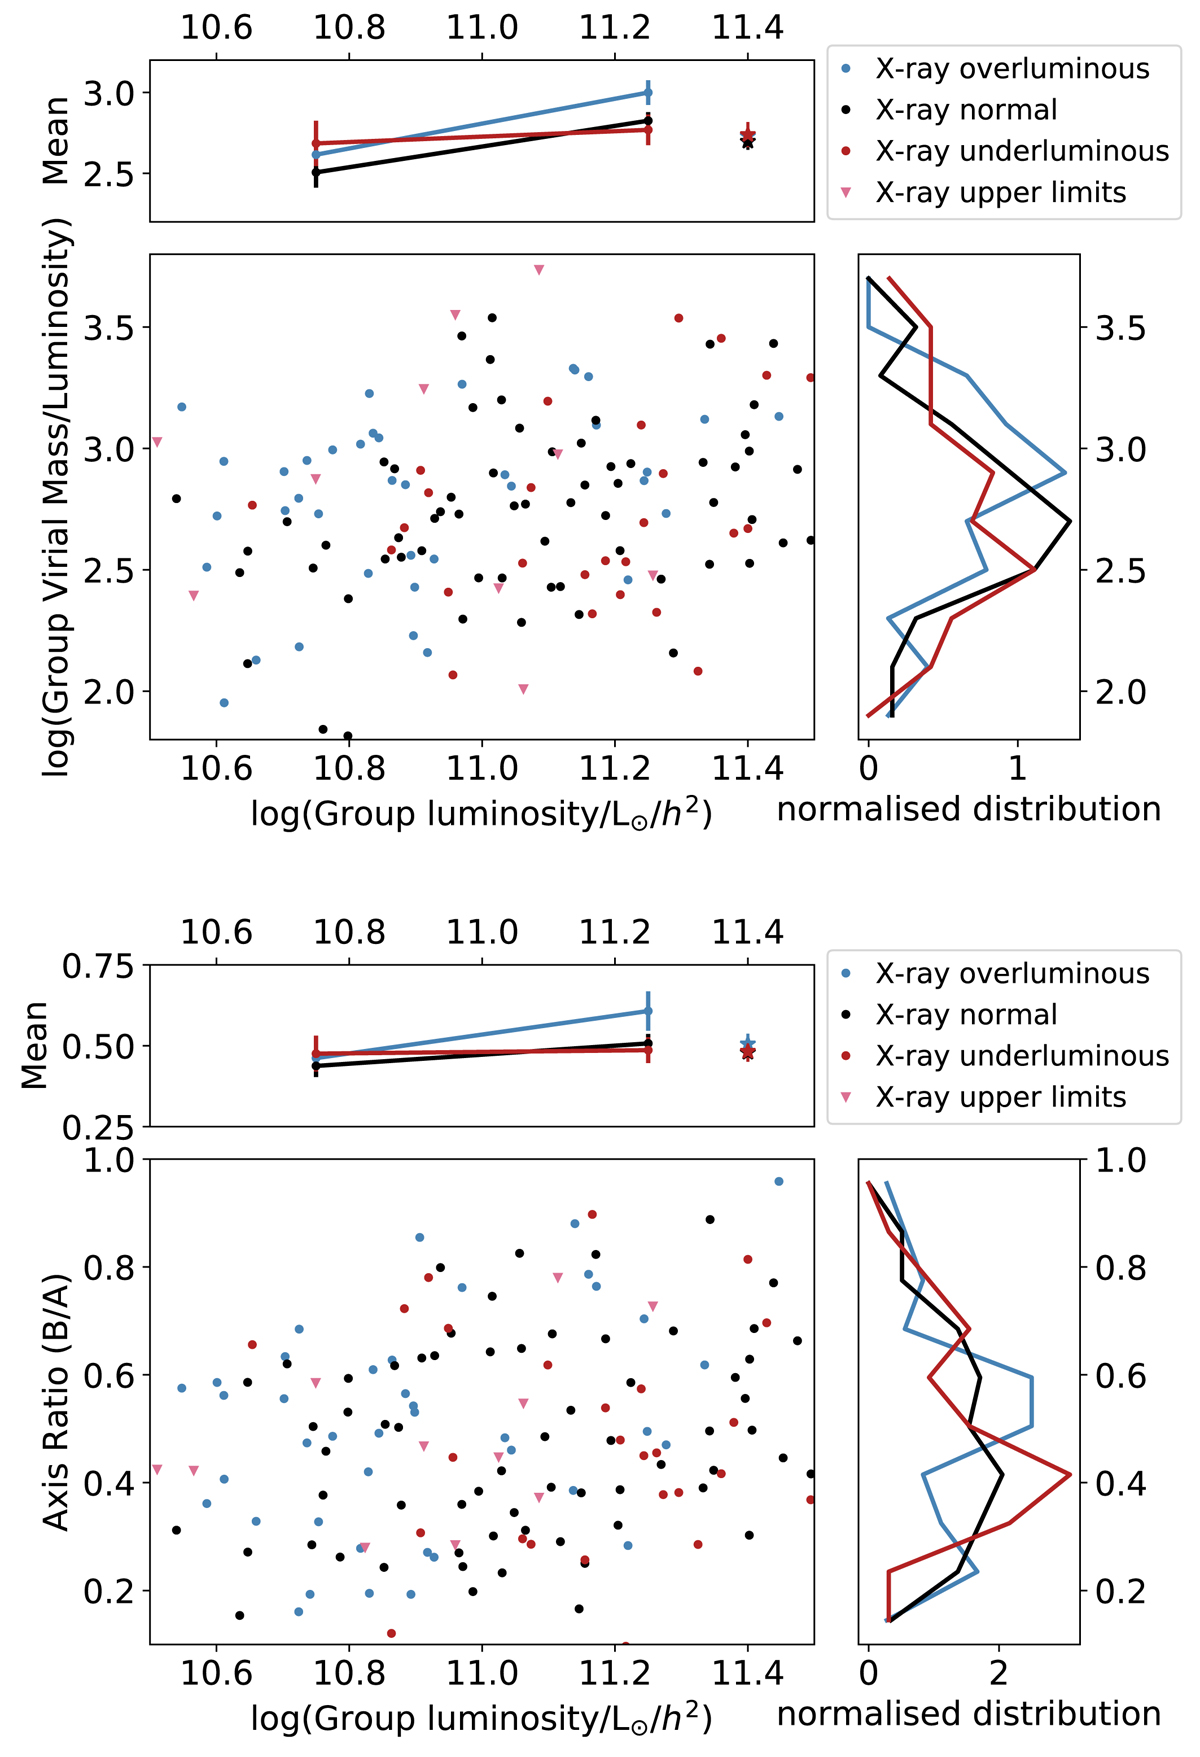
Similar to Fig. 8, showing the difference in the group scaled mass ratio (Group Mass/Lopt, top) and group axial ratio (B/A, bottom). In both plots there appears to be a difference between the over- and underluminous groups in high Lopt systems. This is explored further in Sect. 5.2. However, a comparison of the full distribution for either parameter does not show significant differences between the overluminous and underluminous sample.
Current usage metrics show cumulative count of Article Views (full-text article views including HTML views, PDF and ePub downloads, according to the available data) and Abstracts Views on Vision4Press platform.
Data correspond to usage on the plateform after 2015. The current usage metrics is available 48-96 hours after online publication and is updated daily on week days.
Initial download of the metrics may take a while.