Fig. 1.
Download original image
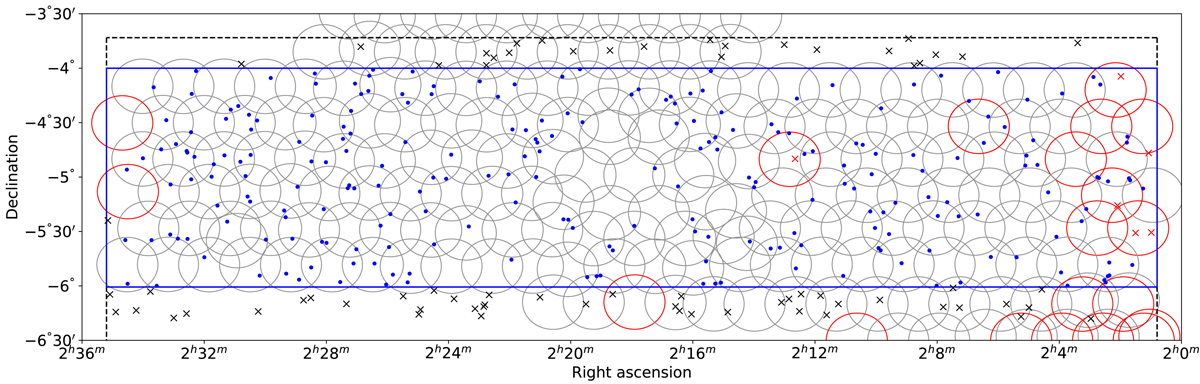
Locations of the FoF group centres (blue points) with respect to the XXL fields (grey and red circles). The GAMA field used in this study is shown with a blue box, taken as a subset from the G02 field (dashed black lines). We remove six optical groups (red crosses) that lie in fields with high sky backgrounds (red circles), in addition to groups outside our matching area (black crosses). The remaining 232 groups (blue points) are taken for this analysis (see Table 1 for details).
Current usage metrics show cumulative count of Article Views (full-text article views including HTML views, PDF and ePub downloads, according to the available data) and Abstracts Views on Vision4Press platform.
Data correspond to usage on the plateform after 2015. The current usage metrics is available 48-96 hours after online publication and is updated daily on week days.
Initial download of the metrics may take a while.