Fig. 3.
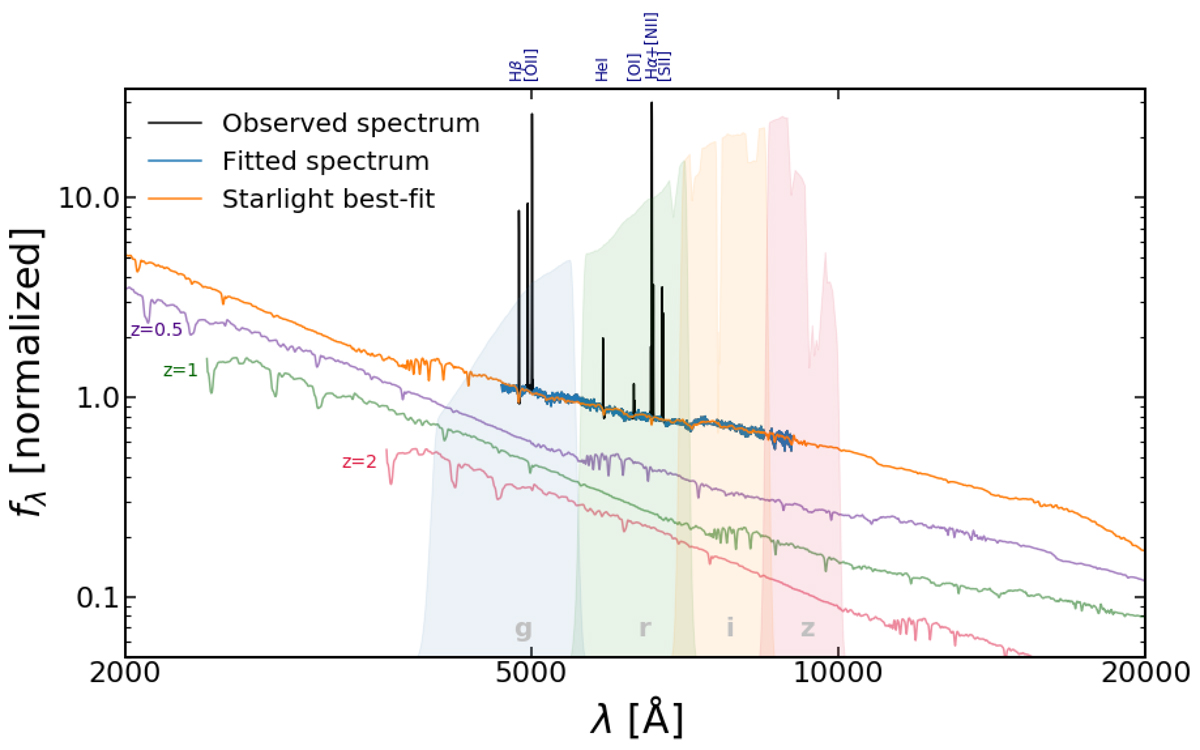
Download original image
Example spectrum with an extended wavelength coverage obtained from the best-fit STARLIGHT model (in orange) compared to the original MUSE data (in black). The best fit is done on the masked spectra (in blue). The transmission curves of the DES filters are shown as shaded regions. We also show the observed wavelengths of the redshifted spectra at z = 0.5, 1, and 2 in this figure as the purple, green, and red lines, respectively. Vertical offsets were applied for better visualisation. On top of the plot we identify the observed strong emission lines.
Current usage metrics show cumulative count of Article Views (full-text article views including HTML views, PDF and ePub downloads, according to the available data) and Abstracts Views on Vision4Press platform.
Data correspond to usage on the plateform after 2015. The current usage metrics is available 48-96 hours after online publication and is updated daily on week days.
Initial download of the metrics may take a while.