Fig. 2.
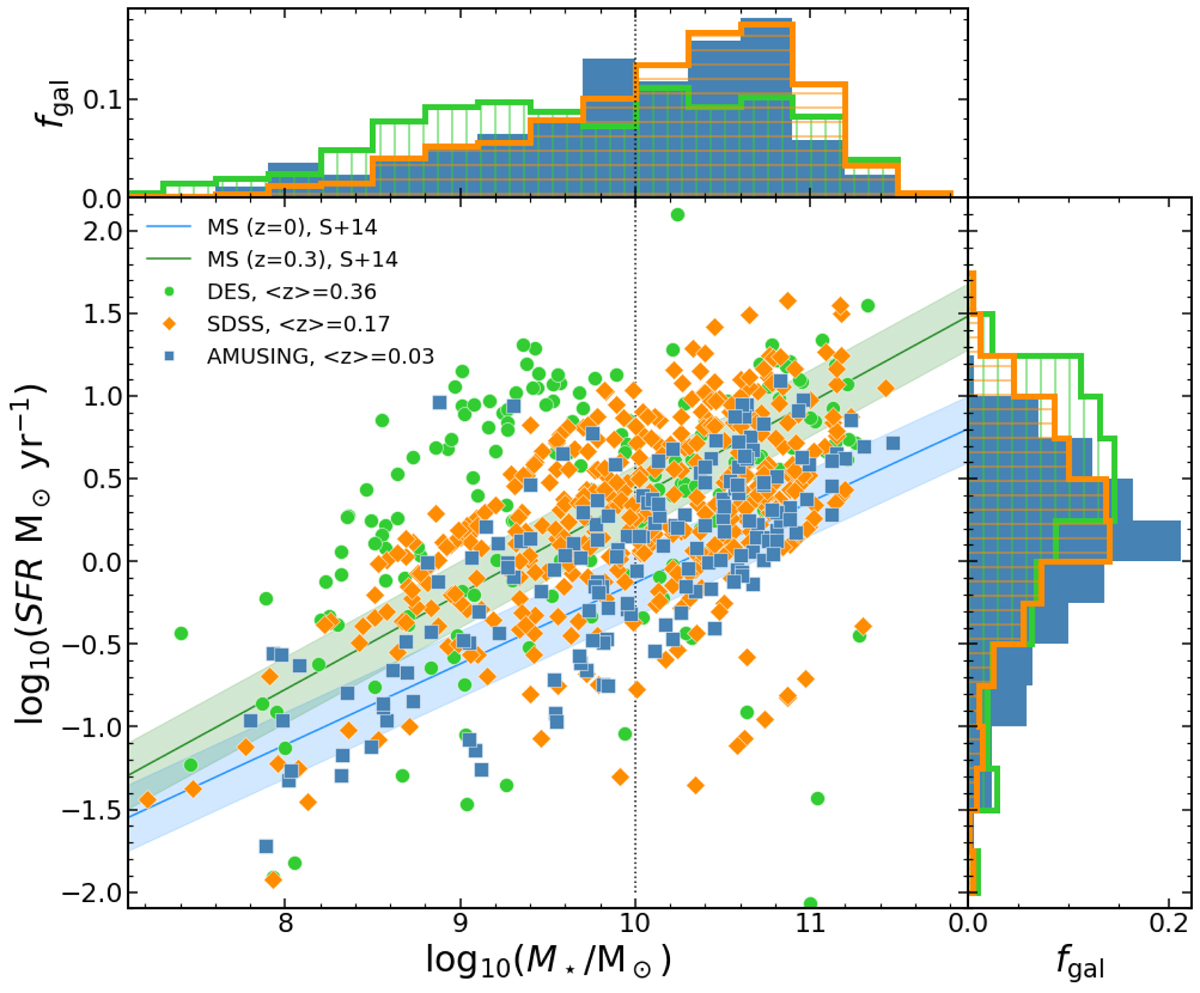
Download original image
Comparison of the AMUSING sample stellar masses and SFRs computed using MAGPHYS, see Sect. 4 (in blue), with the sample from Smith et al. (2020) (in green) and the one from Sako et al. (2018) (in orange). We show as lines with shaded regions the expected relation between stellar mass and SFR (commonly referred to as the main sequence) for the population of star-forming galaxies at different redshifts (adapted from Speagle et al. 2014). We show in the upper panel the stellar mass distributions and in the right panel the SFR distributions for the three samples. We highlight the 1010 M⊙ threshold for SNe Ia brightness corrections (see e.g. Sullivan et al. 2010) as the vertical dotted line.
Current usage metrics show cumulative count of Article Views (full-text article views including HTML views, PDF and ePub downloads, according to the available data) and Abstracts Views on Vision4Press platform.
Data correspond to usage on the plateform after 2015. The current usage metrics is available 48-96 hours after online publication and is updated daily on week days.
Initial download of the metrics may take a while.