Open Access
Fig. 4
Download original image
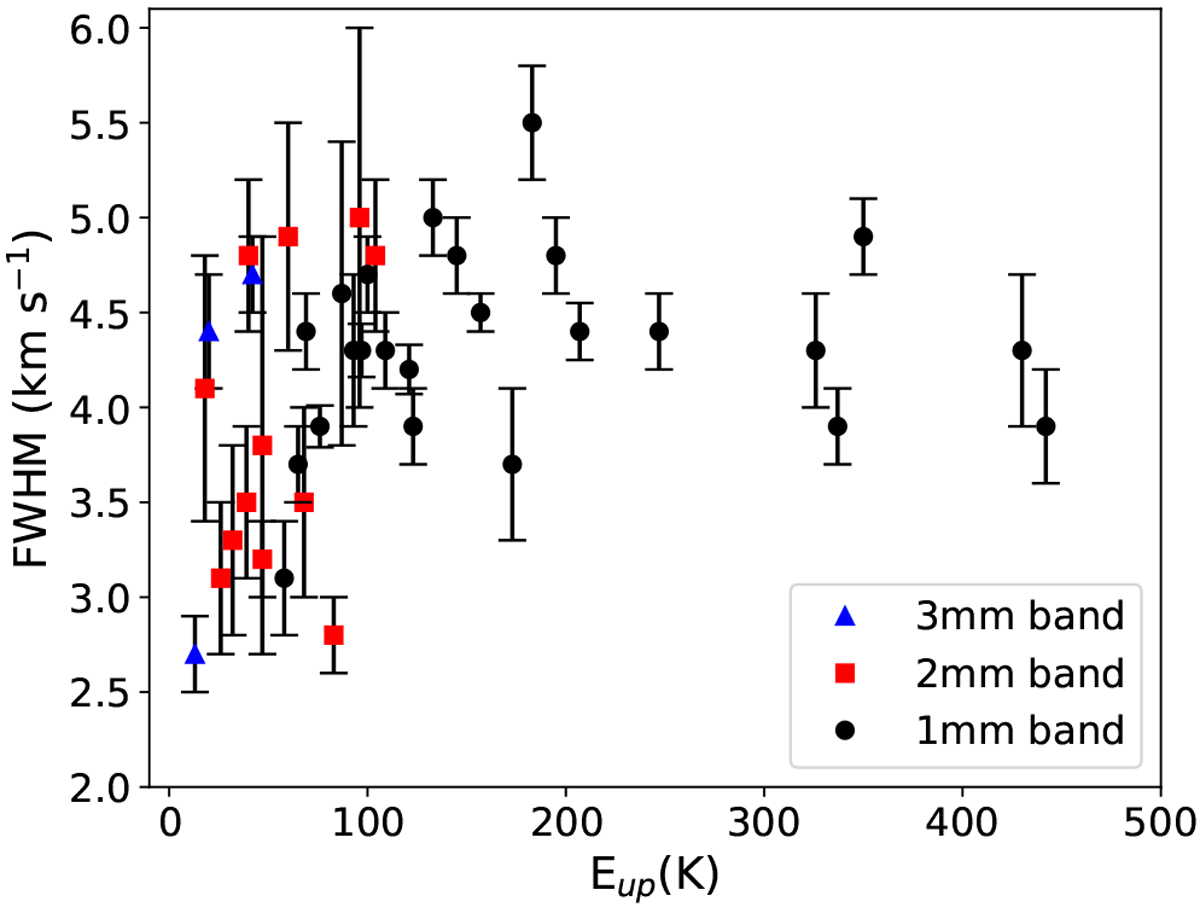
Line widths (FWHMs) of the CH3CN lines detected with the ASAI observations (Table A.1) as a function of the upper level energy of the transitions (Eup). The different colours are for the lines observed in different IRAM-30m bands: blue (3 mm), red (2 mm), and black (1.3 mm).
Current usage metrics show cumulative count of Article Views (full-text article views including HTML views, PDF and ePub downloads, according to the available data) and Abstracts Views on Vision4Press platform.
Data correspond to usage on the plateform after 2015. The current usage metrics is available 48-96 hours after online publication and is updated daily on week days.
Initial download of the metrics may take a while.