Fig. 8
Download original image
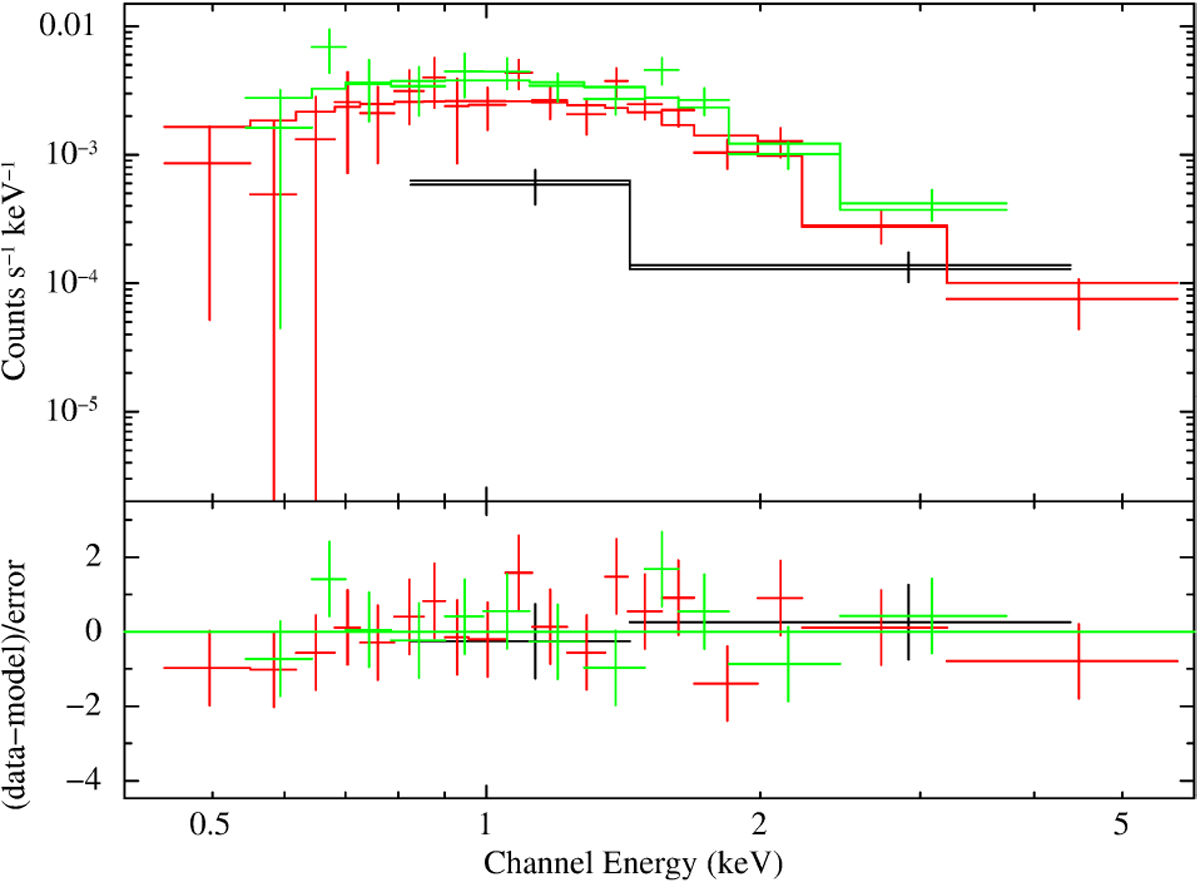
Combined eROSITA spectra of XMMUJ052417.1–692533 from the cameras with on-chip filter (TM1–4 and TM6). The best-fit absorbed power-law model is shown as a histogram, and the residuals are plotted in the bottom panel. The different colours indicate the observations 700156 (black), 700179 (red), and 700184 (green). The spectrum from observation 700156 includes data from TM6 only (see Table 1).
Current usage metrics show cumulative count of Article Views (full-text article views including HTML views, PDF and ePub downloads, according to the available data) and Abstracts Views on Vision4Press platform.
Data correspond to usage on the plateform after 2015. The current usage metrics is available 48-96 hours after online publication and is updated daily on week days.
Initial download of the metrics may take a while.