Fig. 22
Download original image
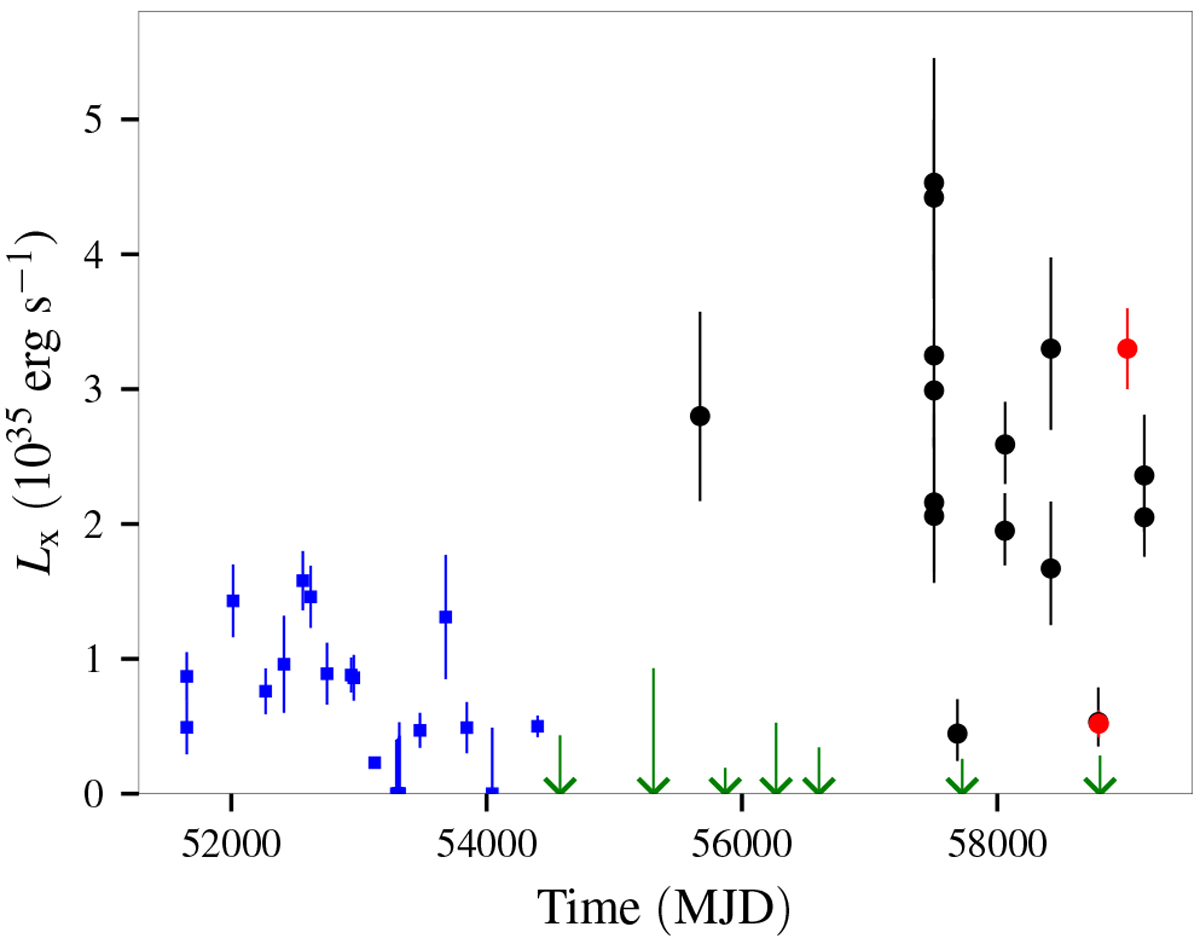
Variability of SXP 726 as observed by XMM-Newton and eROSITA (red). The blue points correspond to flux values reported by Eger & Haberl (2008b), whereas black points are reported here for the first time. The upper limits for observations when the source was not detected are also indicated (green arrows).
Current usage metrics show cumulative count of Article Views (full-text article views including HTML views, PDF and ePub downloads, according to the available data) and Abstracts Views on Vision4Press platform.
Data correspond to usage on the plateform after 2015. The current usage metrics is available 48-96 hours after online publication and is updated daily on week days.
Initial download of the metrics may take a while.