Fig. 21
Download original image
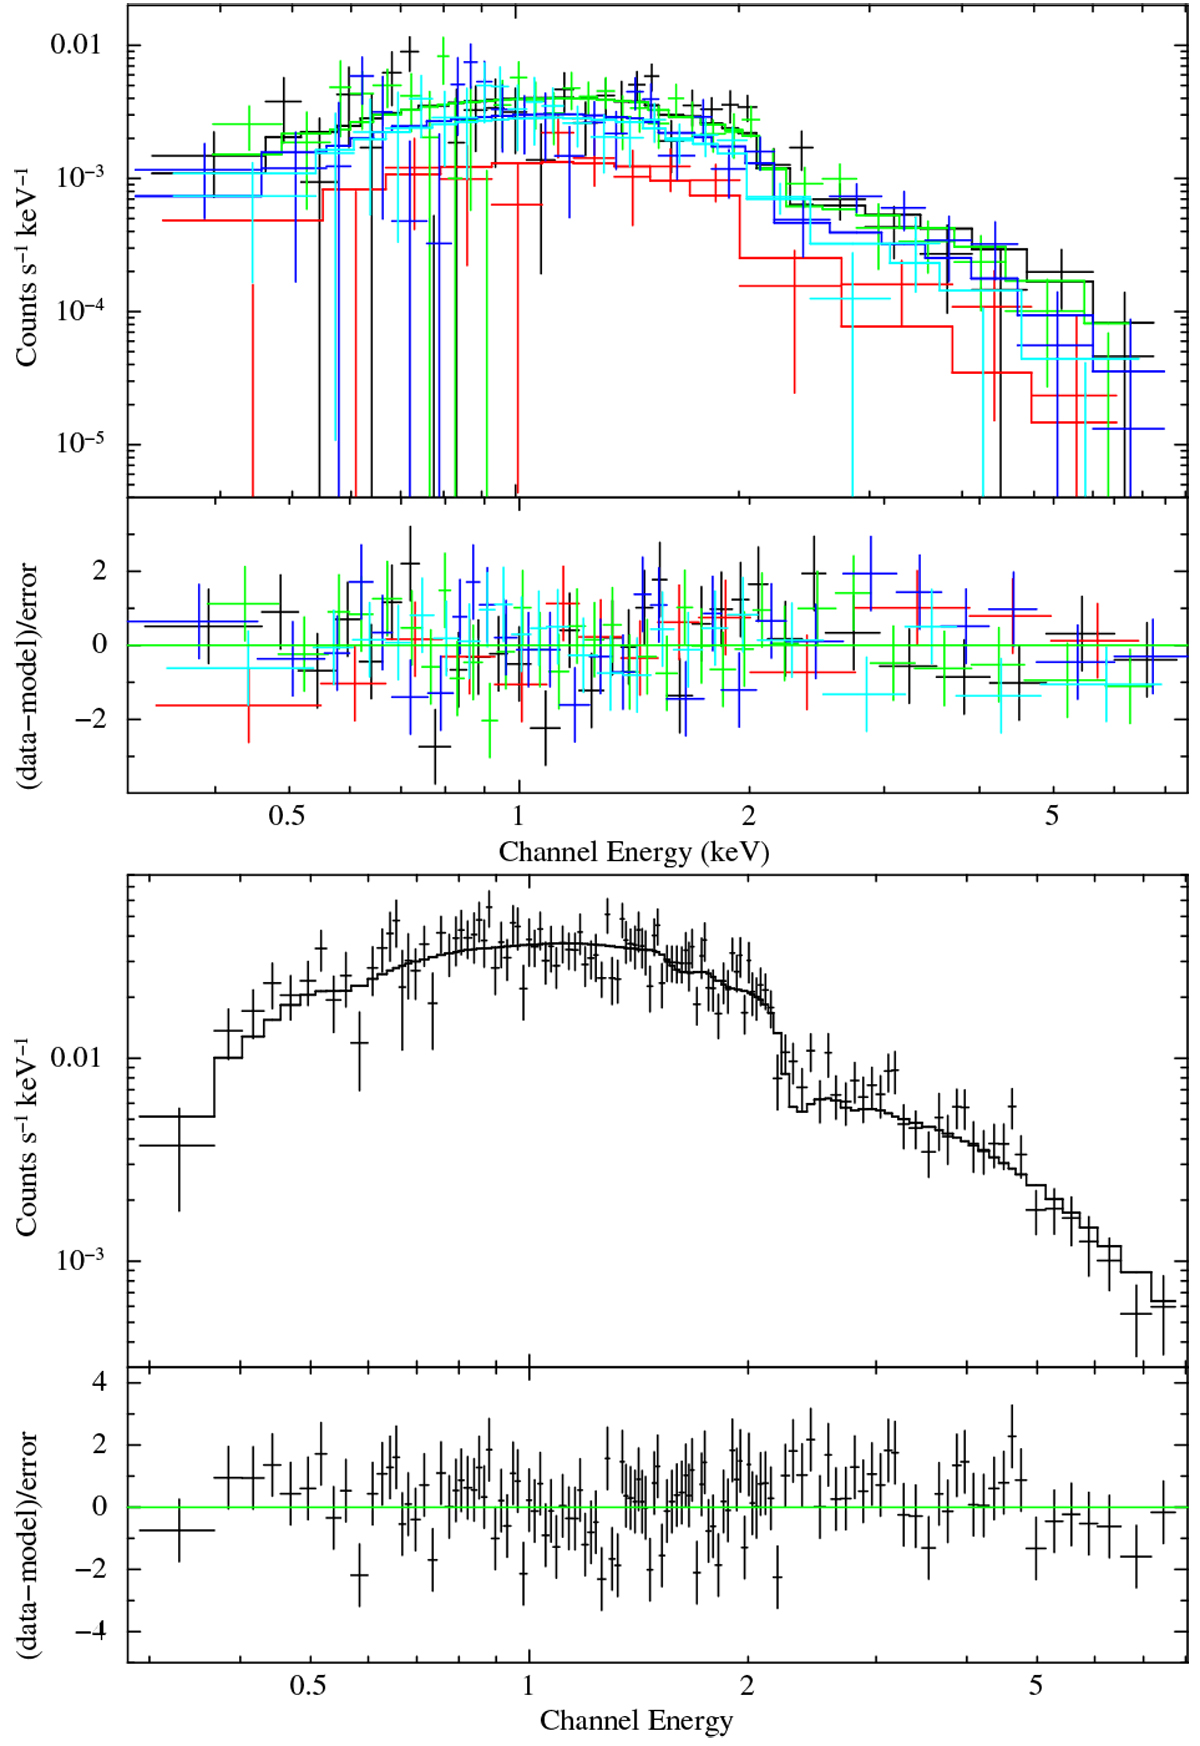
Top: simultaneous spectral fit of an absorbed power law to the spectra of SXP 726 using observations 700001–5 (marked in black, red, green, blue, and cyan, respectively). Bottom: spectrum of SXP 726 from observation 710000. All spectra are obtained by combining data from TM1–4 and 6. The histograms trace the best-fit model, and the residuals are plotted in the narrow panels.
Current usage metrics show cumulative count of Article Views (full-text article views including HTML views, PDF and ePub downloads, according to the available data) and Abstracts Views on Vision4Press platform.
Data correspond to usage on the plateform after 2015. The current usage metrics is available 48-96 hours after online publication and is updated daily on week days.
Initial download of the metrics may take a while.