Fig. 18
Download original image
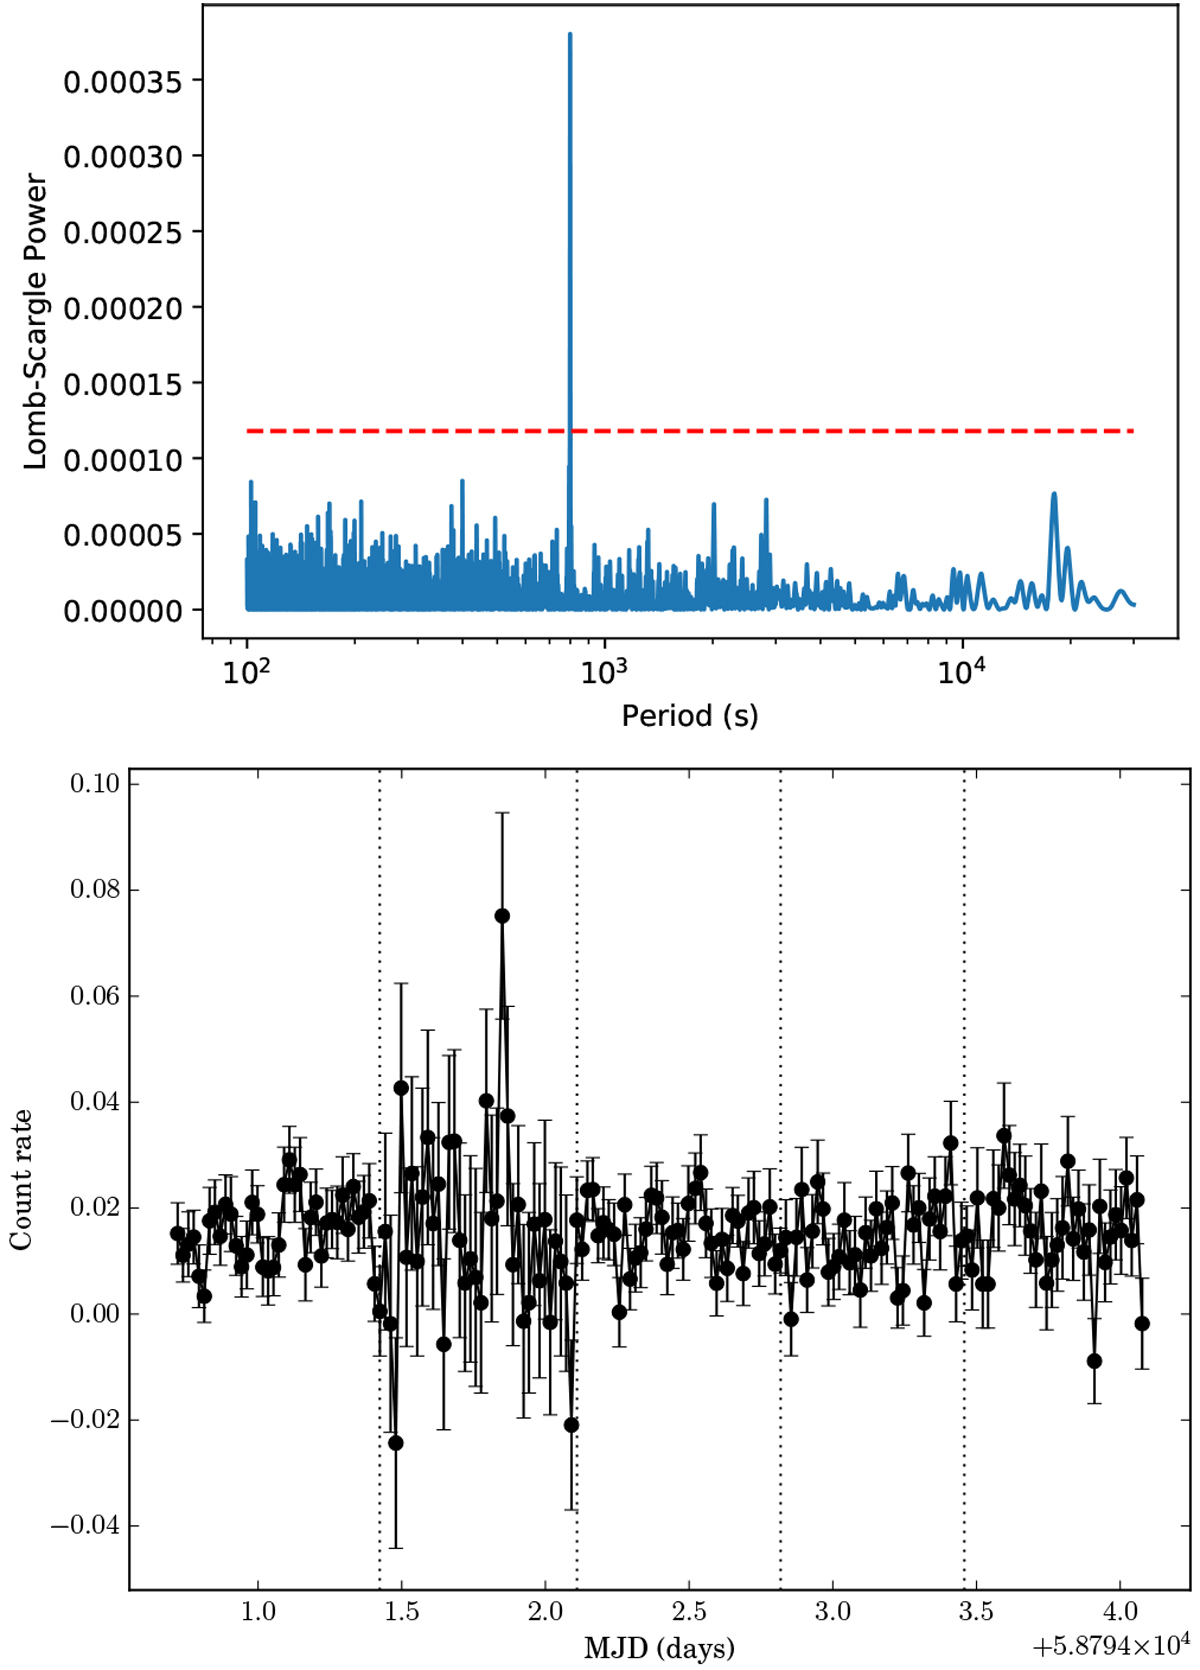
Top: LS periodogram obtained from the combined light curve of SXP 726 shown below. The dashed red line indicates the 99% confidence level. Bottom: background-subtracted and vignetting-corrected light curve of SXP 726 (binned at twice the pulse period) in the energy band of 0.2–8 keV.
Current usage metrics show cumulative count of Article Views (full-text article views including HTML views, PDF and ePub downloads, according to the available data) and Abstracts Views on Vision4Press platform.
Data correspond to usage on the plateform after 2015. The current usage metrics is available 48-96 hours after online publication and is updated daily on week days.
Initial download of the metrics may take a while.