Fig. 17
Download original image
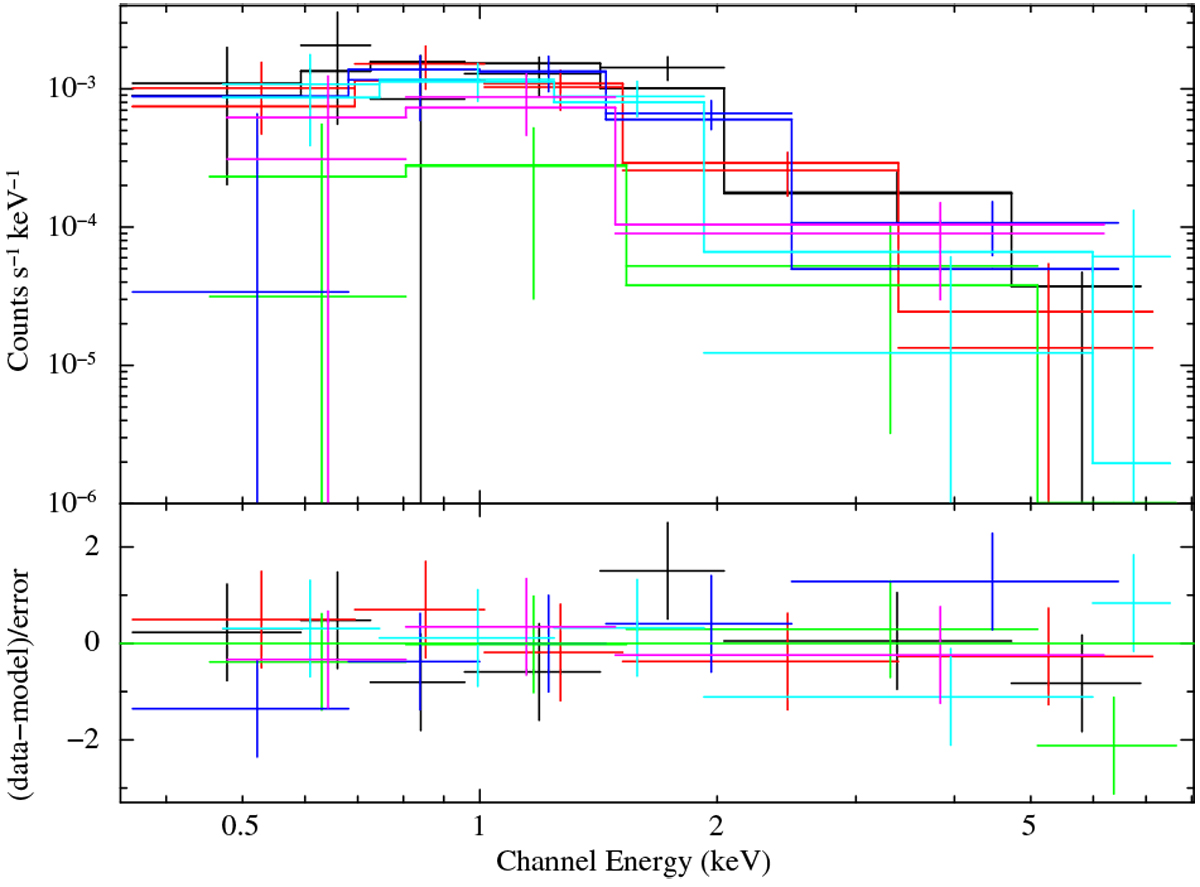
eROSITA spectra of SXP 522 obtained from observations 700001–5 marked in black, red, green, blue, and cyan, respectively, and 710000 (magenta). Each spectrum includes data from TM1–4 and 6. The histograms show the best-fit model, and the residuals are drawn in the lower panel.
Current usage metrics show cumulative count of Article Views (full-text article views including HTML views, PDF and ePub downloads, according to the available data) and Abstracts Views on Vision4Press platform.
Data correspond to usage on the plateform after 2015. The current usage metrics is available 48-96 hours after online publication and is updated daily on week days.
Initial download of the metrics may take a while.