Fig. 11
Download original image
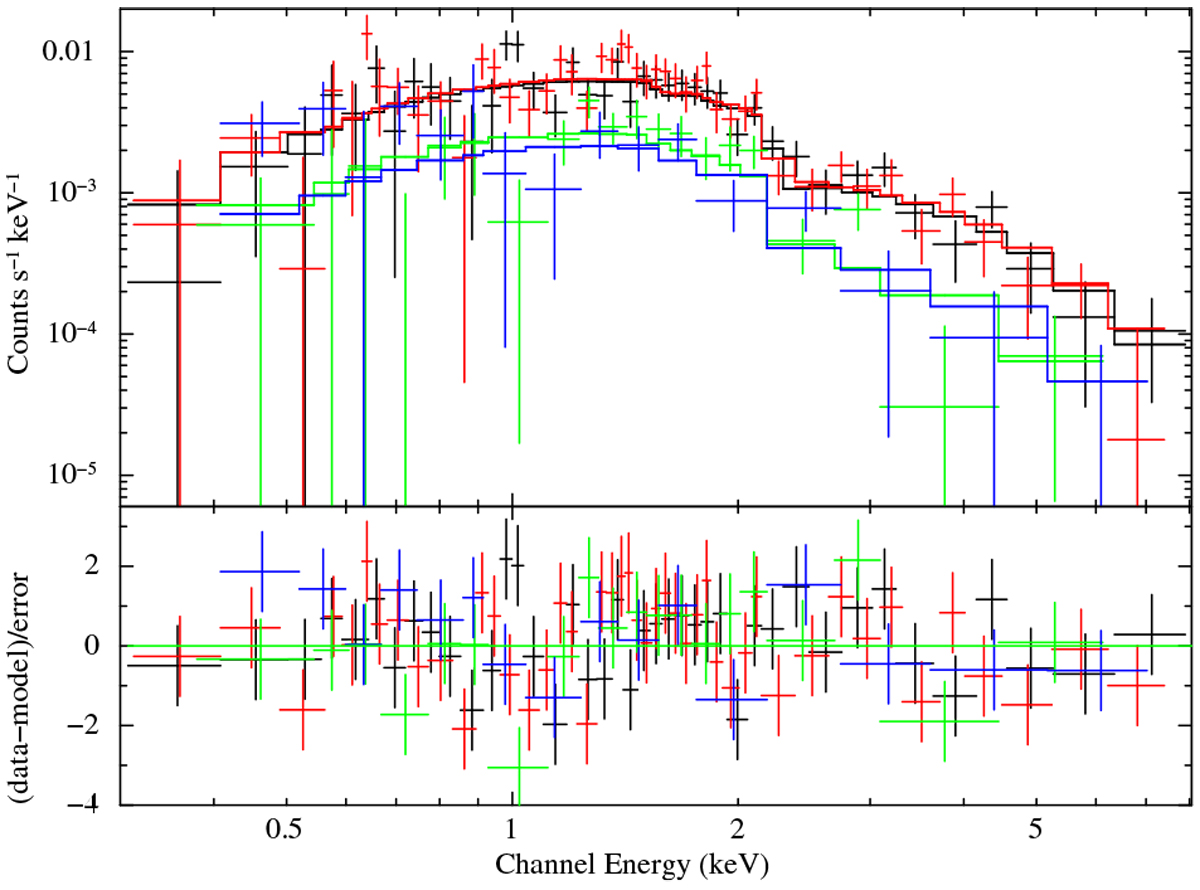
Simultaneous spectral fit of SXP 304 spectra from observations 700001 (black), 700002 (red), 700004 (green), and 710000 (blue), showing the best-fit model as a histogram and the residuals in the bottom panel. Each spectrum was obtained by combining the data from TM1–4 and 6.
Current usage metrics show cumulative count of Article Views (full-text article views including HTML views, PDF and ePub downloads, according to the available data) and Abstracts Views on Vision4Press platform.
Data correspond to usage on the plateform after 2015. The current usage metrics is available 48-96 hours after online publication and is updated daily on week days.
Initial download of the metrics may take a while.