Error
  • The template for this display is not available. Please contact a Site administrator.
The Early Data Release of eROSITA and Mikhail Pavlinsky ART-XC on the SRG mission
Open Access

Fig. 4

image

Download original image

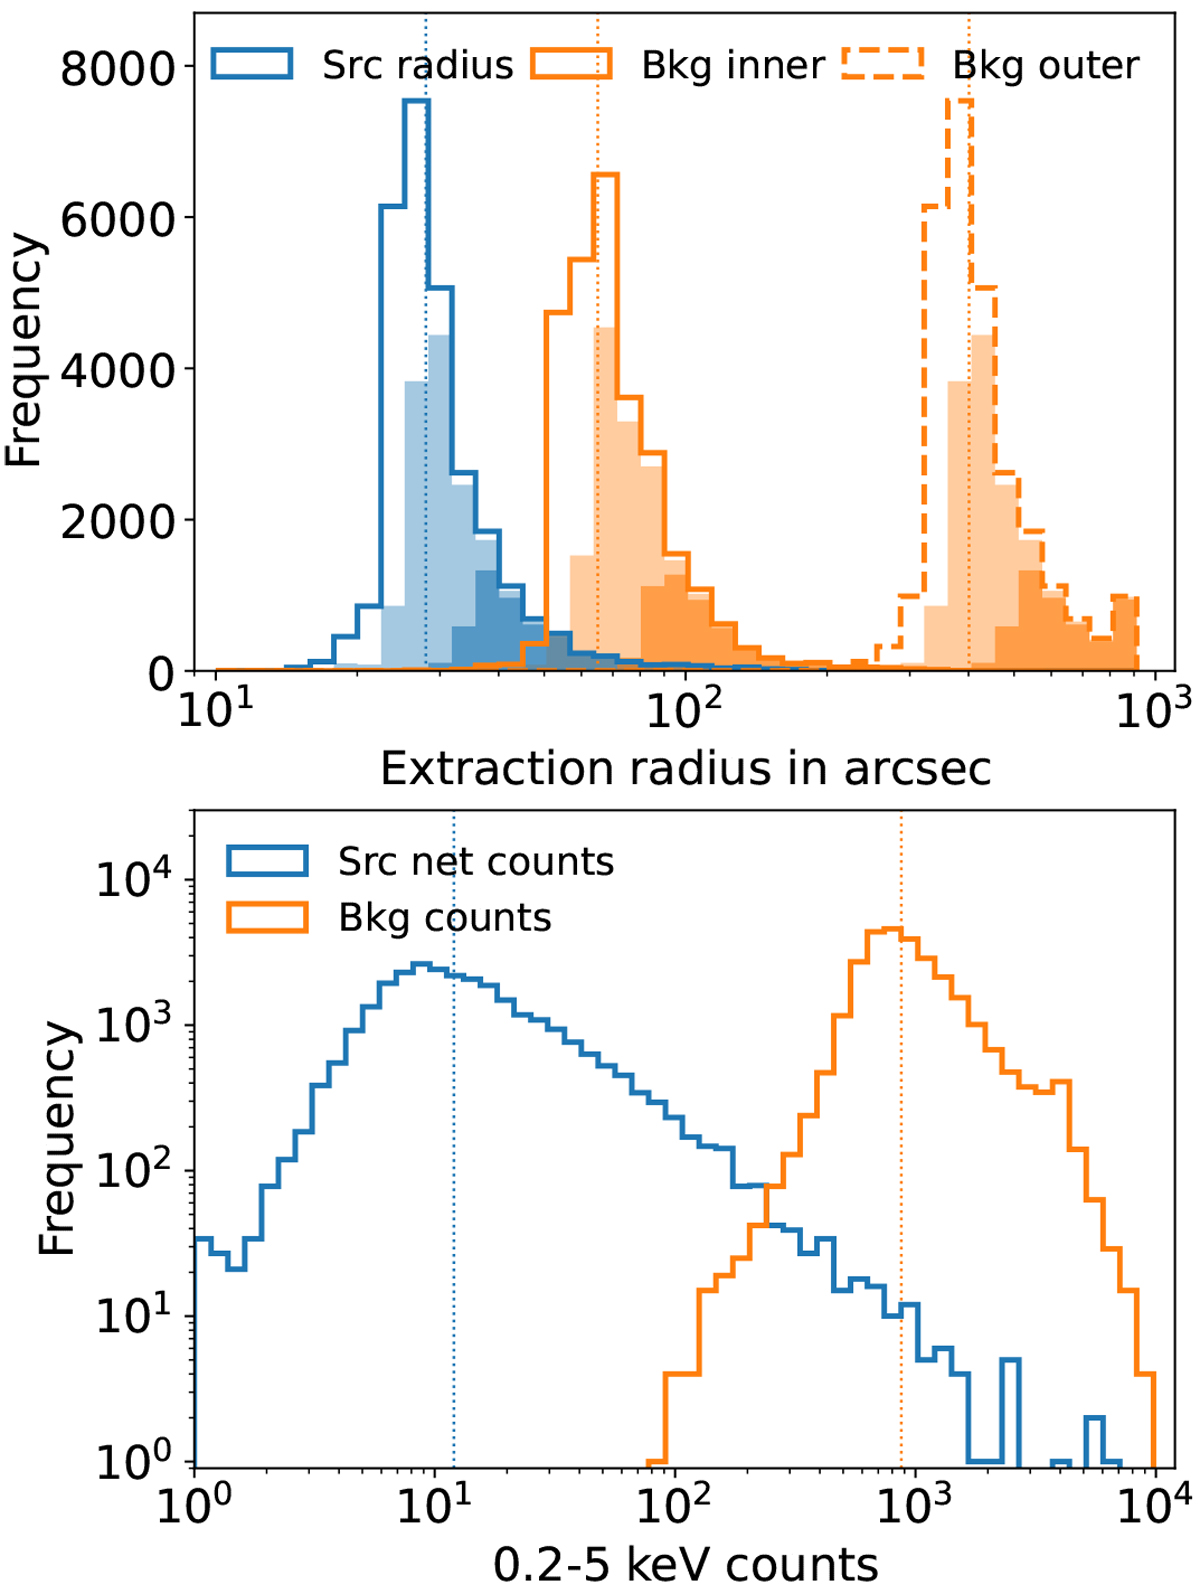
Distributions of source (blue) and background (orange) extraction radii (upper panel) and distributions of source net counts and background counts in the 0.2–5 keV band (lower panel). The median values of the whole sample are marked with dotted vertical lines. The two-level shaded regions indicate the subsamples of the sources with source net counts ⩾10 and ⩾30, respectively.

Current usage metrics show cumulative count of Article Views (full-text article views including HTML views, PDF and ePub downloads, according to the available data) and Abstracts Views on Vision4Press platform.

Data correspond to usage on the plateform after 2015. The current usage metrics is available 48-96 hours after online publication and is updated daily on week days.

Initial download of the metrics may take a while.