Fig. 6.
Download original image
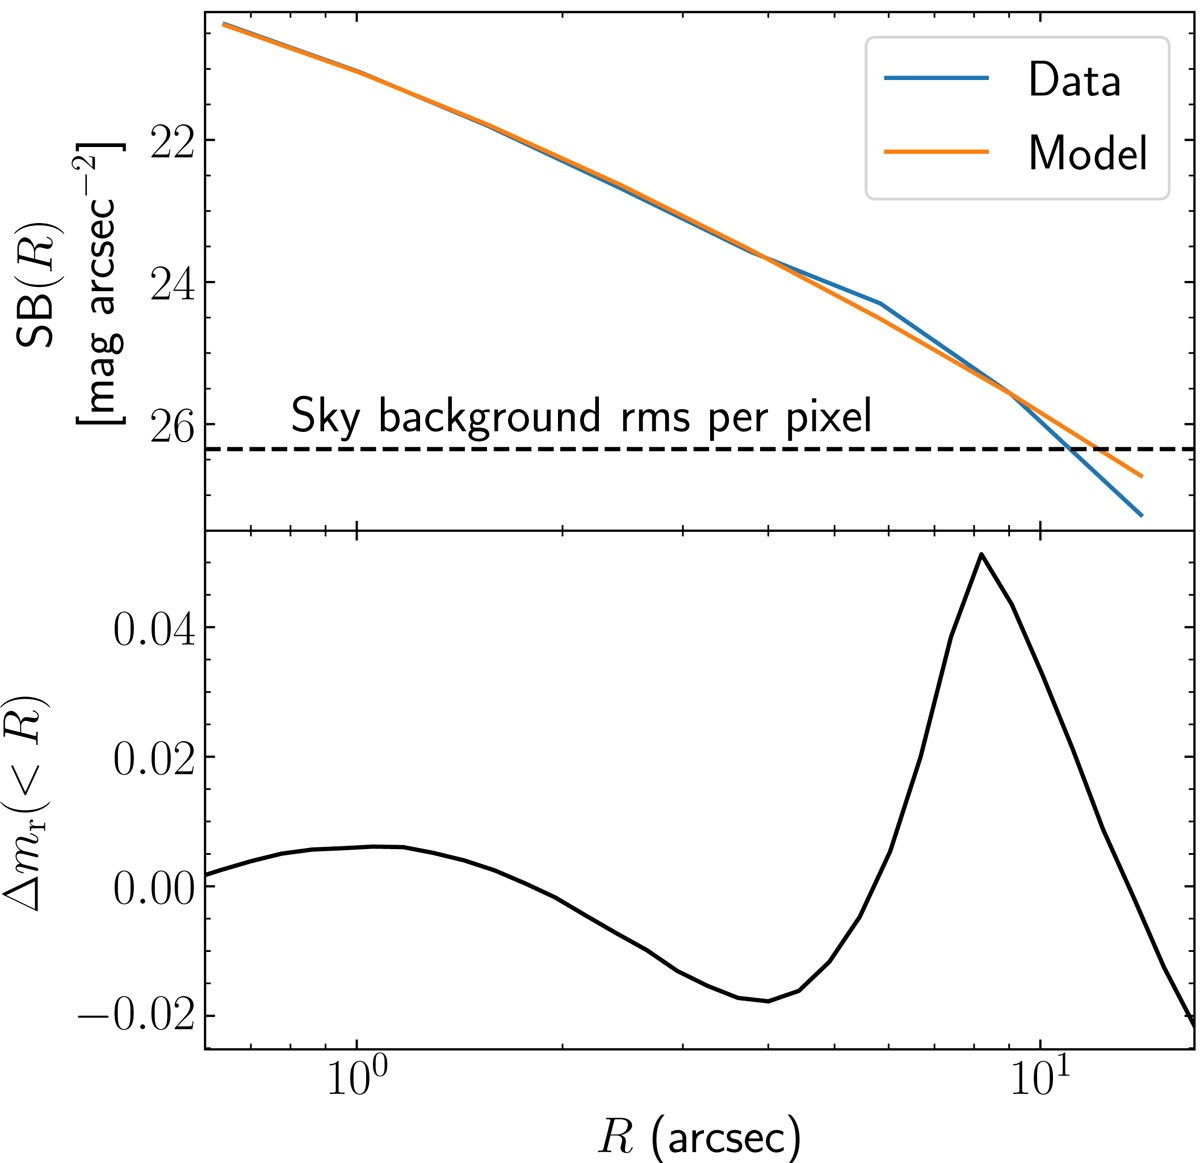
Quantitative analysis of the fit of Fig. 5. Top: azimuthally averaged surface brightness profile of the galaxy and best-fit Sérsic model. The horizontal dashed line marks the sky background root mean square surface brightness fluctuation for a single pixel. Bottom: difference between the magnitude within radius R of the model and that of the true galaxy image, as a function of R.
Current usage metrics show cumulative count of Article Views (full-text article views including HTML views, PDF and ePub downloads, according to the available data) and Abstracts Views on Vision4Press platform.
Data correspond to usage on the plateform after 2015. The current usage metrics is available 48-96 hours after online publication and is updated daily on week days.
Initial download of the metrics may take a while.