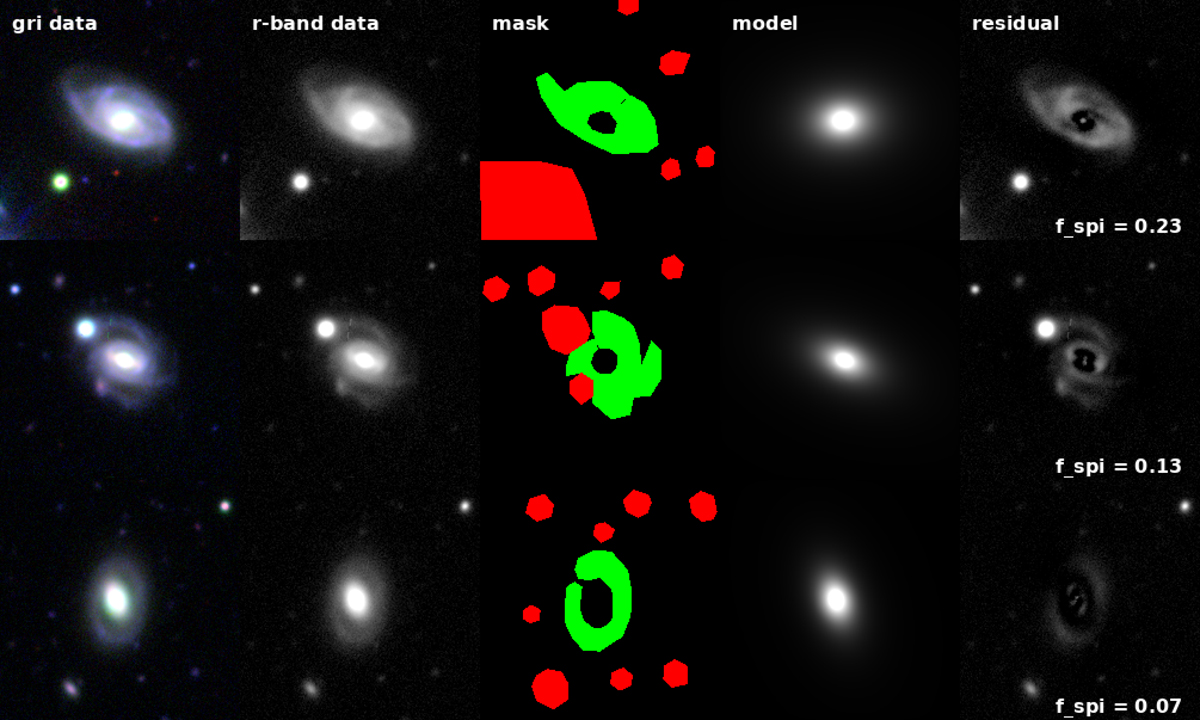
Fig. 2.
Download original image
Fits of a Sérsic profile to the smooth component of the surface brightness distribution of three example galaxies. Column 1: colour-composite image of the galaxy in the HSC g, r, and i bands. Column 2: grey-scale image of the galaxy in the HSC r band. Column 3: area over which the spiral arms dominate the surface brightness (green regions) and contaminants (red regions). Both are masked out from the fit. Column 4: best-fit model of the smooth component in the r band. Column 5: residual in the r band. The value of the r-band spiral-to-total flux ratio is shown in the bottom-right corner.
Current usage metrics show cumulative count of Article Views (full-text article views including HTML views, PDF and ePub downloads, according to the available data) and Abstracts Views on Vision4Press platform.
Data correspond to usage on the plateform after 2015. The current usage metrics is available 48-96 hours after online publication and is updated daily on week days.
Initial download of the metrics may take a while.