Free Access
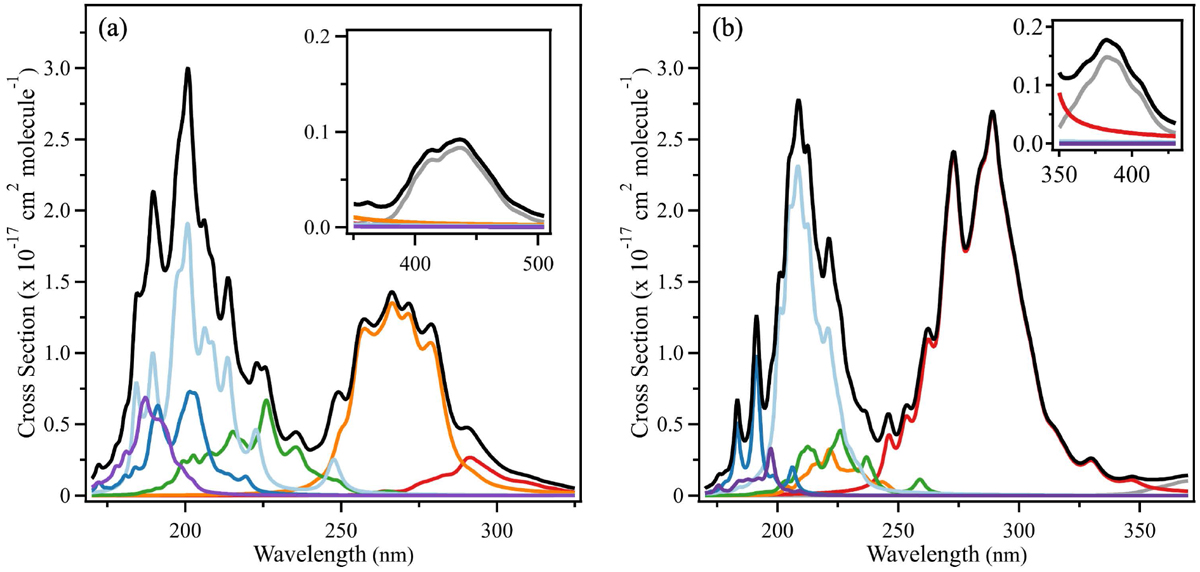
Fig. 4
Download original image
Simulated electronic absorption spectrum of (a) cis-HOPS and (b) cis-HSPO. The total spectrum is shown in black, with individual contributions shown arising from transitions from the ground stateto the 1 1A (gray), 2 1A (red), and 3 1A (orange), 4 1A (green), 5 1A (dark blue), 6 1A (light blue), and 7 1A (purple) states.
Current usage metrics show cumulative count of Article Views (full-text article views including HTML views, PDF and ePub downloads, according to the available data) and Abstracts Views on Vision4Press platform.
Data correspond to usage on the plateform after 2015. The current usage metrics is available 48-96 hours after online publication and is updated daily on week days.
Initial download of the metrics may take a while.