Fig. 9.
Download original image
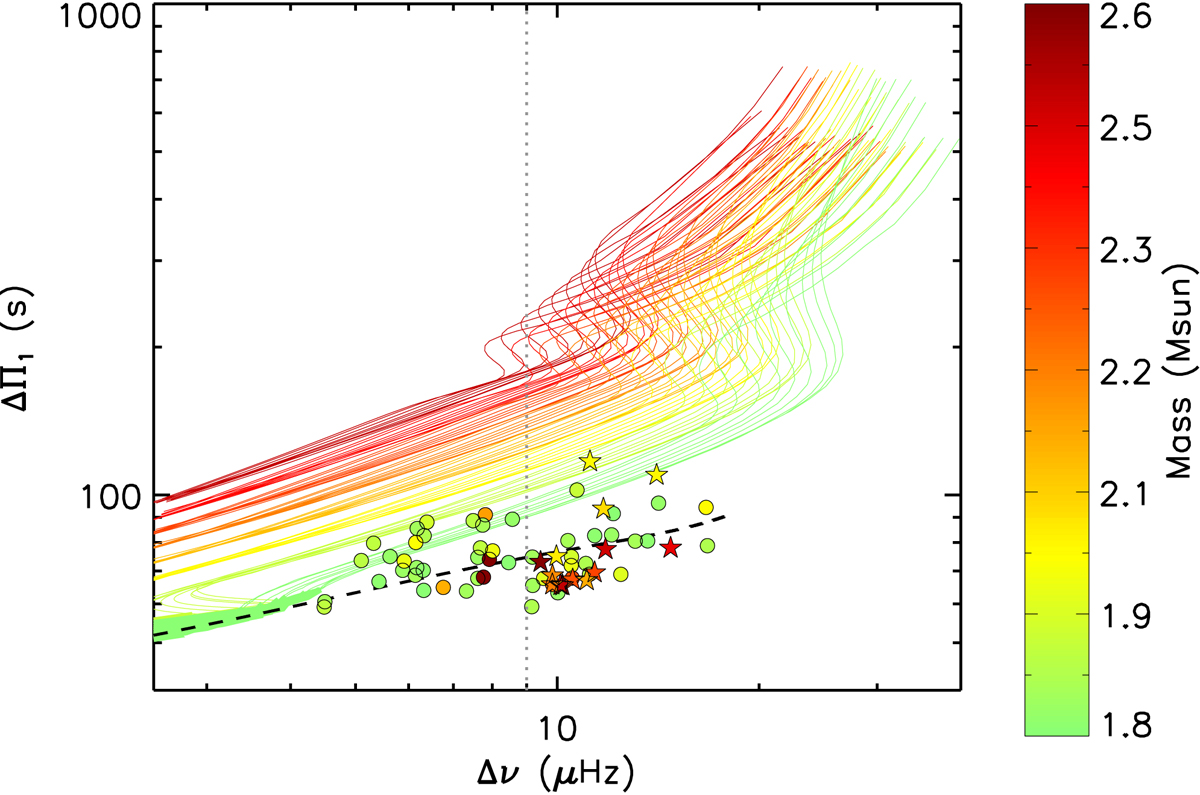
Location in the Δν − ΔΠ1 plane of RGB stars with masses above 1.8 M⊙. The colors indicate the stellar mass, following the same scale as in Fig. 2. Evolutionary tracks of stellar models with αov = 0.1 are displayed with thick lines when electron degeneracy is strong in the core, and thin lines otherwise. Circles correspond to RGB stars studied by V16 and star-shaped symbols indicate stars from Yu et al. (2018) with period spacing measured in this study (see Sect. 5.3). The black dashed line corresponds to the average degenerate sequence obtained from observations. The vertical gray dotted line shows the limit of Δν = 9 μHz, above which we have performed new measurements of ΔΠ1 in Sect. 5.2.
Current usage metrics show cumulative count of Article Views (full-text article views including HTML views, PDF and ePub downloads, according to the available data) and Abstracts Views on Vision4Press platform.
Data correspond to usage on the plateform after 2015. The current usage metrics is available 48-96 hours after online publication and is updated daily on week days.
Initial download of the metrics may take a while.