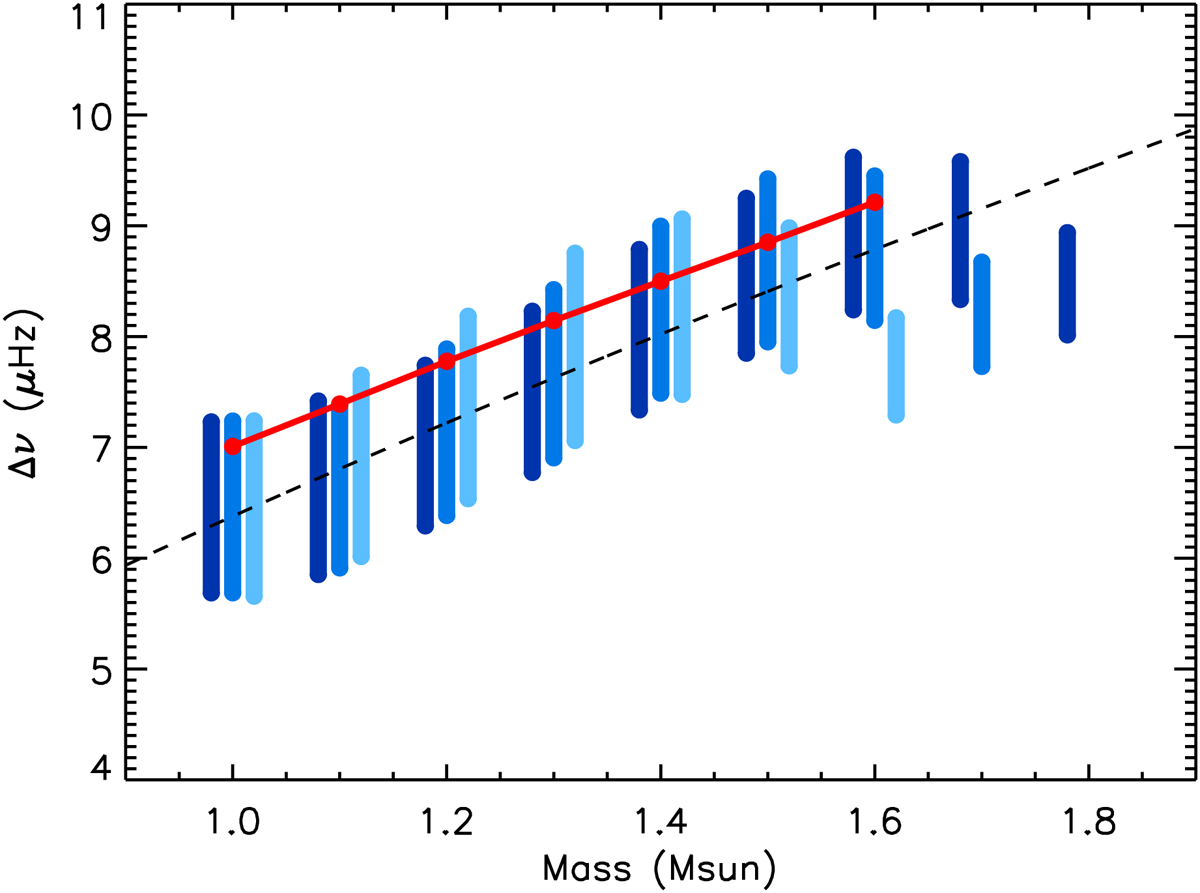
Fig. 6.
Download original image
Variations in Δν as a function of stellar mass at fixed value of ΔΠ1 (71 ± 0.5 s). Blue filled circles represent models from our grid, with αov = 0, 0.1, and 0.2 from light blue to dark blue. For clarity, a small artificial shift in mass was applied to clearly separate models with different αov. The black dashed line corresponds to the fit of a power law to the Δν − M relation using the models of the grid. Red circles connected by a thick red line correspond to a 1.6 M⊙ stellar model to which various amounts of mass loss have been applied (see Sect. 4.3).
Current usage metrics show cumulative count of Article Views (full-text article views including HTML views, PDF and ePub downloads, according to the available data) and Abstracts Views on Vision4Press platform.
Data correspond to usage on the plateform after 2015. The current usage metrics is available 48-96 hours after online publication and is updated daily on week days.
Initial download of the metrics may take a while.