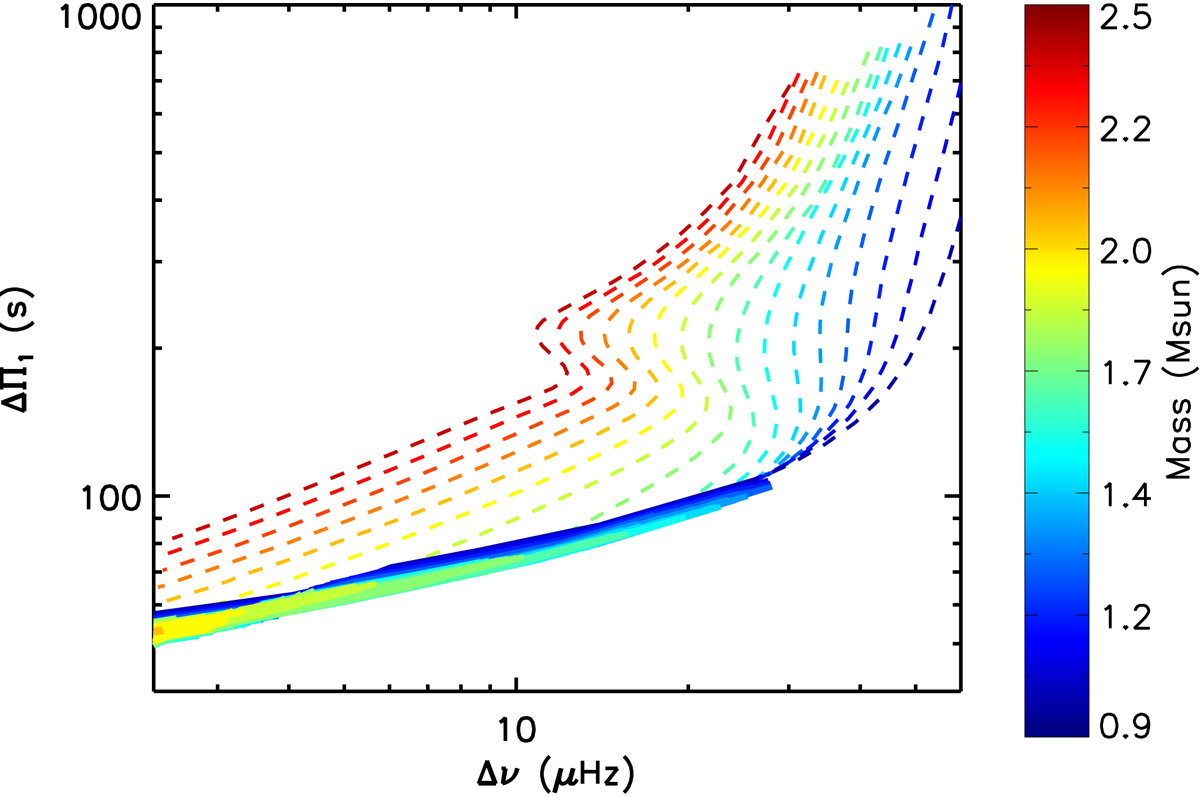
Fig. 2.
Download original image
Evolutionary paths in the Δν − ΔΠ1 plane of stellar models from the grid presented in Sect. 3. Thick solid lines indicate periods of the evolution where electron degeneracy is strong in the core – ψ(r = 0) > 25. Dashed lines correspond to ψ(r = 0) < 25. For clarity, the nondegenerate part of the evolution is shown only for models with solar metallicity and without core overshooting.
Current usage metrics show cumulative count of Article Views (full-text article views including HTML views, PDF and ePub downloads, according to the available data) and Abstracts Views on Vision4Press platform.
Data correspond to usage on the plateform after 2015. The current usage metrics is available 48-96 hours after online publication and is updated daily on week days.
Initial download of the metrics may take a while.